
← return to study.practicaldsc.org
Instructor(s): Suraj Rampure
This exam was administered in-person. The exam was closed-notes,
except students were allowed to bring a single two-sided notes sheet. No
calculators were allowed. Students had 120 minutes to take this exam.
Access the original exam PDF here:
Version A,
Version B. (This site is
based on Version A.)
Note that for the Spring 2025 Midterm Exam,
all of the questions here (except Question 10 on SQL) are in scope, but
there are a few questions from the
Fall 2024
Final Exam that are also in scope that cover topics that aren’t here
(like loss functions and regression). See the top of that exam for more
details.
Skytrax is a website that allows anyone to submit a review for a
flight they took. In this exam, we’ll work with the DataFrame
reviews, which contains flight reviews taken from
Skytrax.
The first few rows of reviews are shown below, but
reviews has many more rows than are shown.

The columns in reviews are as follows:
"airline" (str): The airline flown. Note that an
airline can be reviewed multiple times."author" (str): The author of the review. Note that an
author can write multiple reviews (and can even write multiple reviews
of the same airline!)."date" (str): The date on which the review was written.
Most of the reviews were written in 2015."content" (str): The content of the review."cabin" (str): The cabin the author flew; either
"Economy", "Premium Economy",
"Business", or "First"."overall" (int): The overall rating the author gave
their flight experience, between 0 and 10 (inclusive).Throughout the exam, assume we have already run
import pandas as pd and
import numpy as np.
Fill in the blanks so that santas_airlines evaluates to
an array containing the unique names of the airlines
that Santa Ono has reviewed.
santas_airlines = reviews.loc[__(i)__, __(ii)__].__(iii)__Answer:
santas_airlines = reviews.loc[reviews["author"] == "Santa Ono", "airline"].unique()Conceptually, we need to find a Series containing the names of all of the airlines that Santa Ono has reviewed, and then find the unique values in that Series.
loc helps us extract a subset of the rows and columns in
a DataFrame. In general, loc works as follows:
reviews.loc[<subset of rows>, <subset of columns>]Here: - We want all of the rows where reviews["author"]
is equal to "Santa Ono", so we use the expression
reviews["author"] == "Santa Ono" as the first input to
loc. (Remember,
reviews["author"] == "Santa Ono" is a Series of
Trues and Falses; only the True
values are kept in the result.) - We want just the column
"airline", so we supply it as a string as the second input
to loc.
Now, we have a Series with the names of all airlines that Santa Ono
has reviewed; calling the .unique() method on this Series
will give us back an array with just the unique values
in the Series, which is what we’re looking for here.
The average score on this problem was 88%.
Consider the function operate, defined below.
def operate(df):
    df["content"] = df["content"].str.split().str.len()
Consider the following six answer choices:
Nothing, because we didn’t reassign reviews after
calling operate(reviews).
reviews["content"] now contains the number of
characters per review.
reviews["content"] now contains the number of words
per review.
We see an error because we’re trying to use .str
methods on an invalid column.
We see an error because a column with the name
"content" already exists.
We see an error because we’re assuming df is a
DataFrame but it is None (null).
All three parts of this question are independent from one another; the code in earlier parts should not influence your answers in later parts.
What happens after running the following block of code?
operate(reviews)A
B
C
D
E
F
Answer: C. reviews["content"] now
contains the number of words per review.
The main premise behind this question is that running
operate(reviews) makes an in-place modification to
reviews, because DataFrame objects are
mutable. So, even though we didn’t run
reviews = operate(reviews), reviews was still
updated.
Let’s visualize what happens to the Series
reviews["content"] through the transformation
reviews["content"].str.split().str.len():
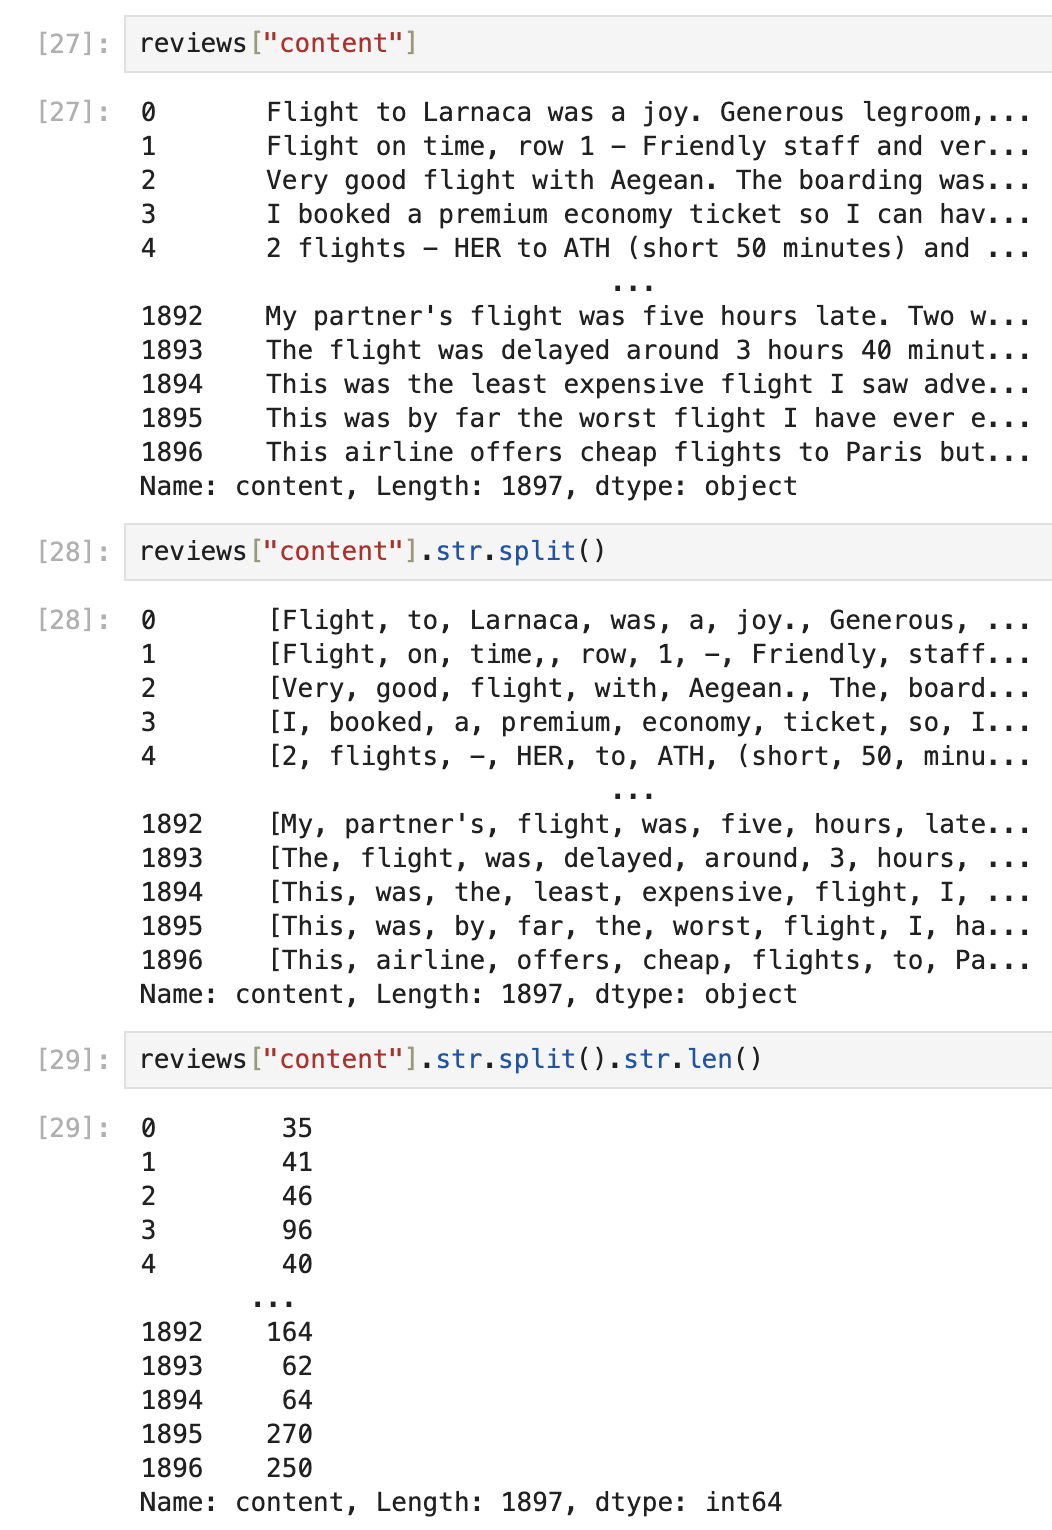
To summarize:
s is a Series of strings, s.str.split()
evaluates to a Series of lists resulting from splitting
each string in s by " " (the default argument
to split is " "). These new lists now contain
all of the words in the original strings.t is a Series of lists, then
t.str.len() evaluates to a Series of ints
containing the lengths of the lists in t. If each list in
t contained words, then the ints in
t.str.len() represent numbers of words.reviews["content"].str.split().str.len() evaluates
to a list containing the number of words per review!
The average score on this problem was 67%.
What happens after running the following block of code?
operate(reviews)
operate(reviews)
A
B
C
D
E
F
Answer: D. We see an error because we’re trying to
use .str methods on an invalid column.
As we discussed in the solution above, after running
operate(reviews), the DataFrame reviews is
modified in-place such that its "content" column contains
the number of words per review. This new "content" column
is made up of ints.
When we try and call operate(reviews) a second time,
we’ll try to use .str.split() on the new
"content" column, but the new "content" column
contains ints! Numbers cannot be “split”, and .str methods
in general don’t work on Series of numbers, so we’ll get an error that
results from this mismatch in types.
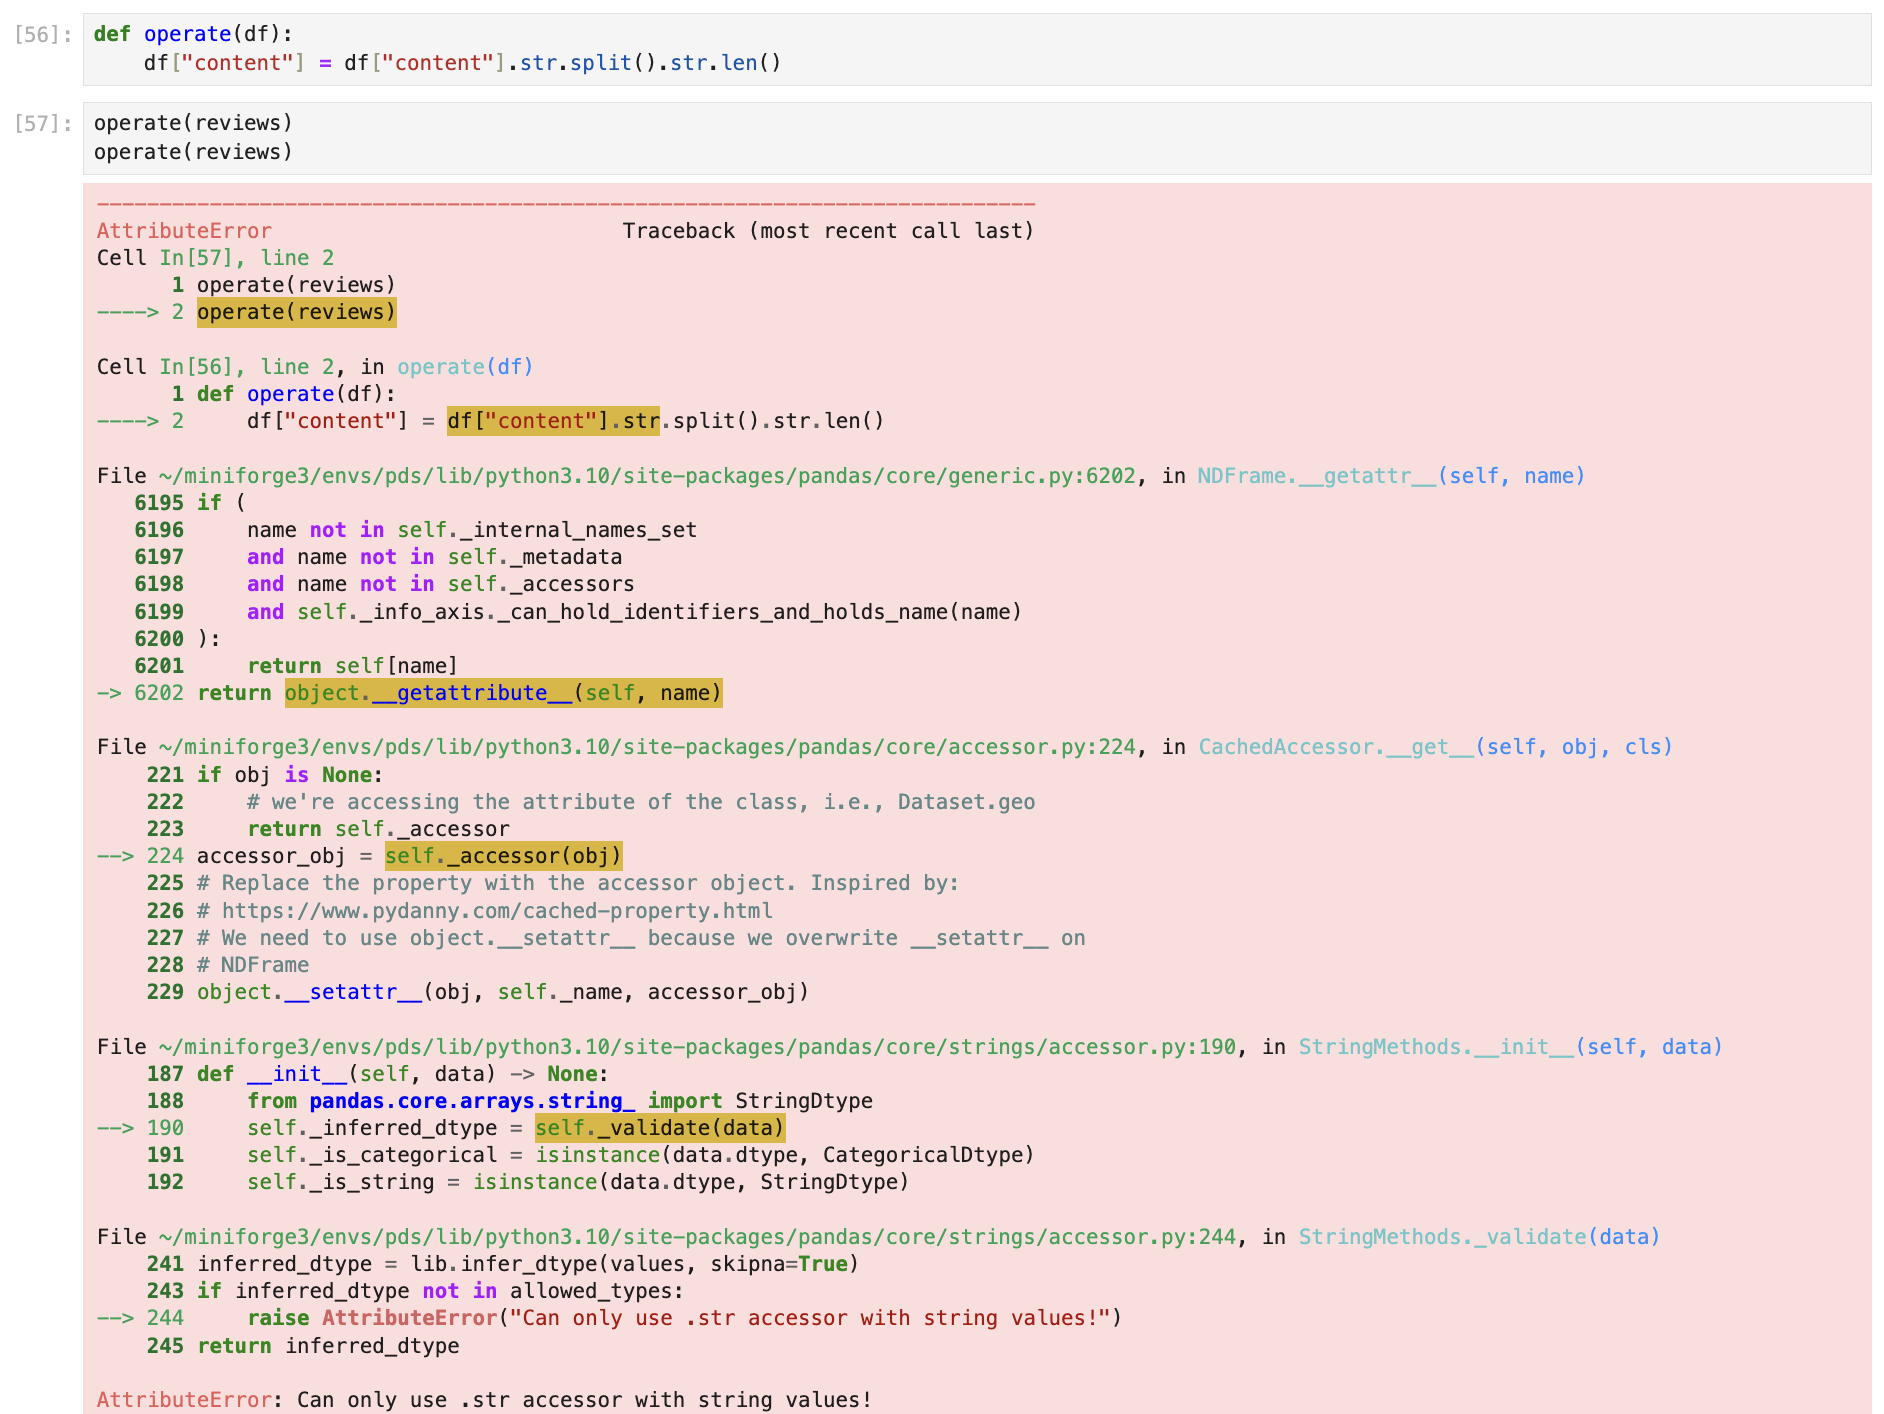
operate(reviews).
The average score on this problem was 62%.
What happens after running the following block of code?
reviews = operate(reviews)
reviews = operate(reviews)
A
B
C
D
E
F
Answer: F. We see an error because we’re assuming
df is a DataFrame but it is None (null).
As discussed in the previous two solutions, after calling
operate(reviews), reviews["content"] now
contains the number of words per review. However, the function
operate itself doesn’t have an explicit return
keyword, which means it returns None, the default Python
null value. That is, operate(reviews) makes an in-place
modification, but outputs None.
So, when we set reviews = operate(reviews), we’re
effectively setting reviews = None, i.e. setting
reviews to a null value. So, the second time
operate(reviews) is called, Python will try to use
None in place of df in the body of
operate:
def operate(df):
    df["content"] = df["content"].str.split().str.len()
But, None["content"] is an undefined operation, and
we’ll get an error to that effect.
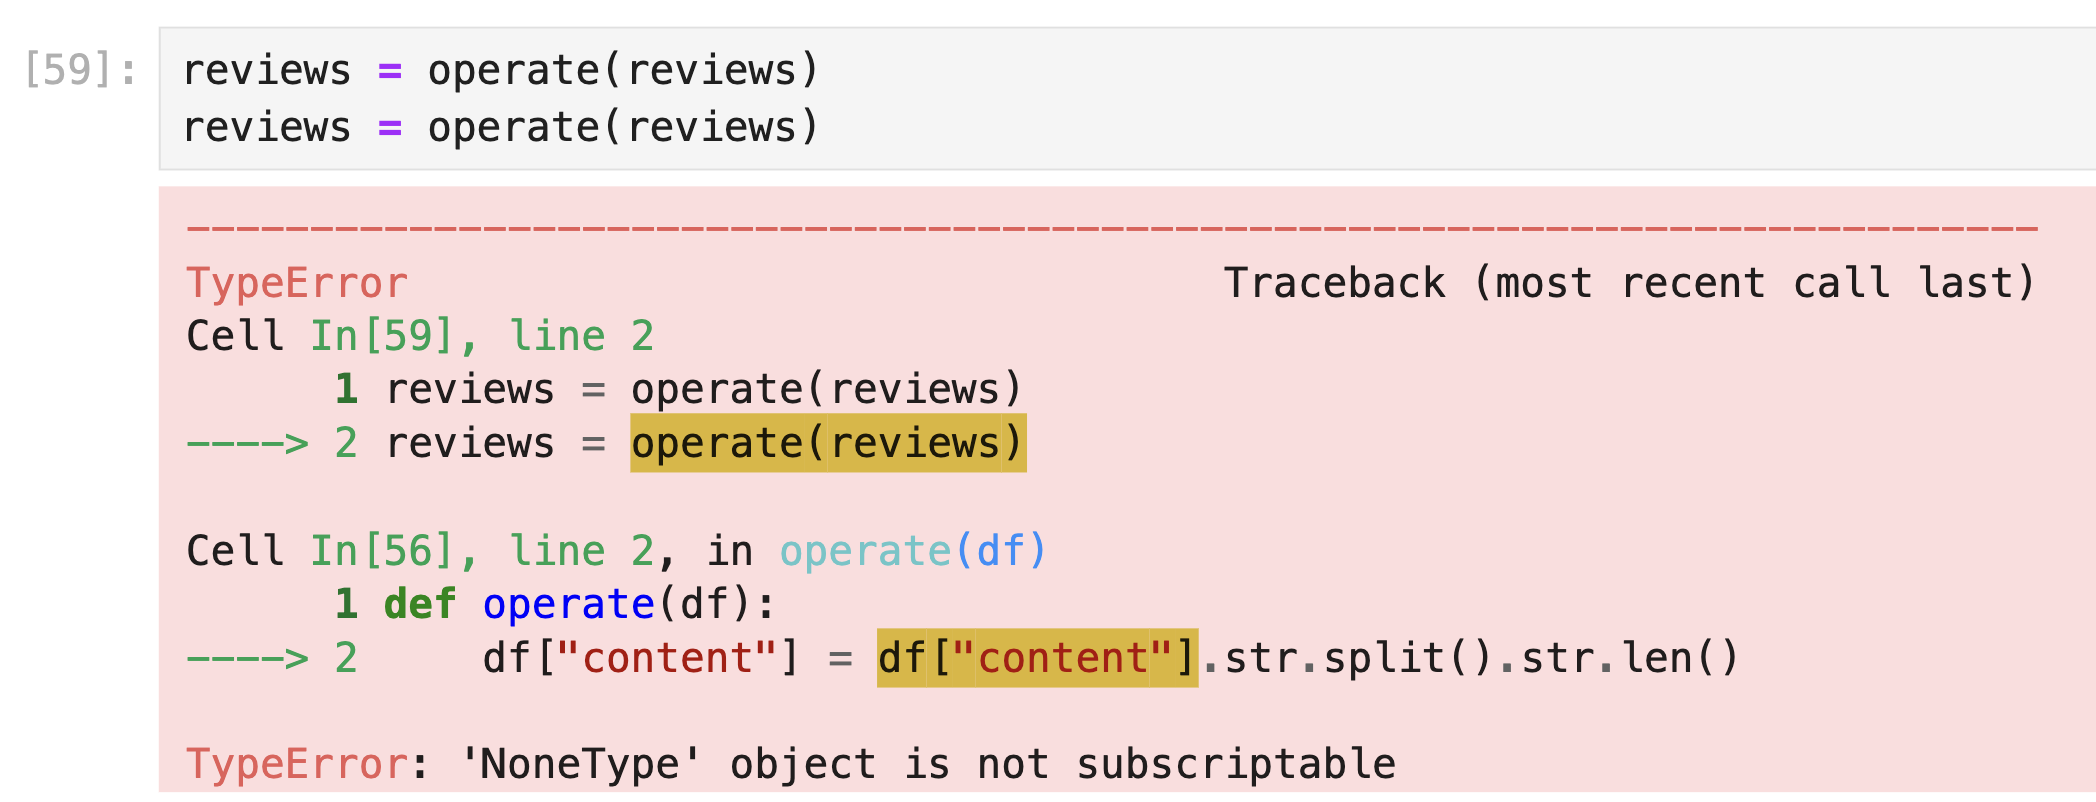
The average score on this problem was 50%.
Suppose we define n = reviews.shape[0].
In each of the four parts of this question, we provide an expression that evaluates to a new DataFrame. Depending on the expression, the new DataFrame:
reviews.reviews appear multiple times
(i.e. may have duplicated rows). Note that reviews itself
does not have any duplicated rows.reviews.For example, if df is on the left, the DataFrame on the
right has the same number of rows as df, has some
duplicated rows (row 1 appears twice), and has the same row order as
df (all row 0s before row 1s, all row 1s before row 2s,
etc.).
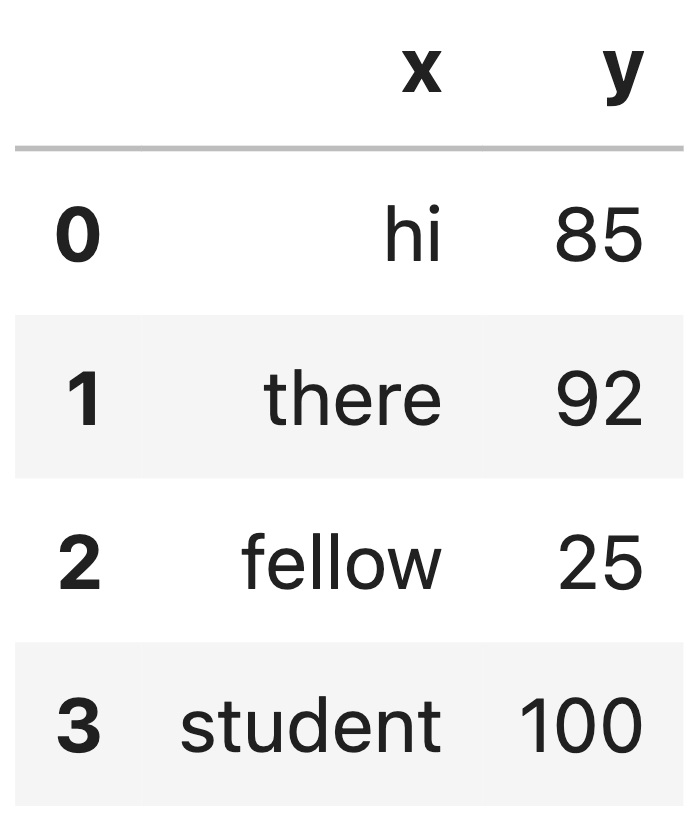
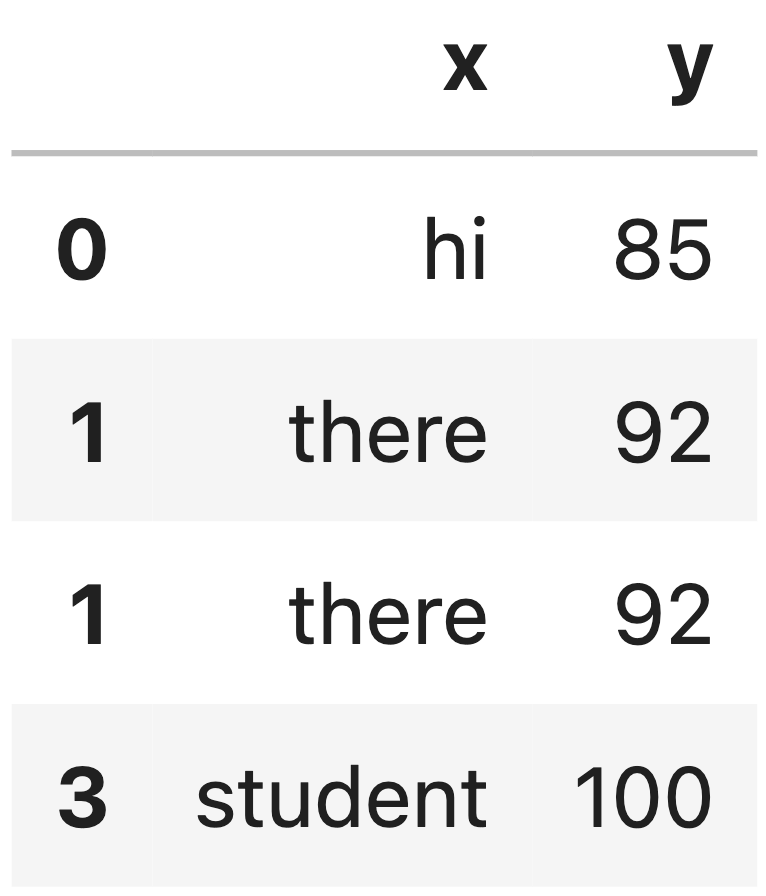
Select the options that correctly describe the DataFrame that results from each of the following expressions.
reviews.loc[np.random.choice([True, False], size=n, replace=True)]Same number of rows as reviews?
Yes
No
Possibility of duplicated rows? Yes No
Row order guaranteed to be the same as reviews?
Yes
No
Answer:
reviews?
No.reviews?
Yes.Here,
np.random.choice([True, False], size=n, replace=True)
evaluates to an array of Trues and Falses with
the same length as reviews. For instance, it may evaluate
to:
np.array([True, False, False, True, True, False, True, False, ...., False])When passing this array into reviews.loc, it is used as
a Boolean mask, the same way that Boolean Series are. For example, we
write reviews.loc[reviews["author"] == "Santa Ono"] – or
reviews[reviews["author"] == "Santa Ono"] for short – we’re
asking to keep all the rows when
reviews["author"] == "Santa Ono" (a Boolean Series)
contains True and exclude all of the rows when that Boolean
Series contains False.
In the above example, we’re saying keep row 0, exclude rows 1 and 2, keep rows 3 and 4, exclude row 5, and so on. In this scheme:
Falses
in the resulting array, we will exclude at least some of the rows in
reviews, so the result will almost certainly not
have the same number of rows as reviews.reviews.
The average score on this problem was 52%.
reviews.loc[np.random.permutation(np.arange(n))]Same number of rows as reviews?
Yes
No
Possibility of duplicated rows? Yes No
Row order guaranteed to be the same as reviews?
Yes
No
reviews?
Yes.reviews?
No.np.arange(n) evaluates to the array:
np.array([0, 1, 2, 3, ..., n - 2, n - 1])where, again, n is the length of reviews.
np.random.permutation shuffles a sequence, without removing
or adding any extra elements, so
np.random.permutation(np.arange(n)) is an array with the
integers between 0 in n - 1 in a random
order.
Separately, as we see in the DataFrame preview provided at the start
of the exam, the index of reviews is 0,
1, 2, 3, etc. When
passing a sequence of index values as the first argument to
reviews.loc, pandas will return a DataFrame
with just the index values you asked for.
For example, reviews.loc[[19, 1, 3, 18]] evaluates to a
DataFrame with 4 rows, specifically, the rows with index values
19, 1, 3, and
18 from reviews. If the index of
reviews wasn’t made up of integers, then
reviews.loc[[19, 1, 3, 18]] would error (and we’d need to
use reviews.iloc, which uses integer positions,
instead).
Putting this all together,
reviews.loc[np.random.permutation(np.arange(n))] will
produce a new DataFrame that results from shuffling all
of the rows in reviews. If
np.random.permutation(np.arange(n)) evalutes to
np.array([235, 11, 4, 953, 23, 1, 355, ...]),
reviews.loc[np.random.permutation(np.arange(n))] will first
have row 235 from reviews, then row
11, and so on.
So, the resulting DataFrame will have the same number of
rows as reviews, and not have any
duplicated rows, but have a different row
order than reviews in all likelihood.
The average score on this problem was 74%.
reviews.loc[np.random.choice(np.arange(n), size=n, replace=True)]Same number of rows as reviews?
Yes
No
Possibility of duplicated rows? Yes No
Row order guaranteed to be the same as reviews?
Yes
No
reviews?
Yes.reviews?
No.The expression
np.random.choice(np.arange(n), size=n, replace=True)
selects n elements with replacement from
np.arange(n), and returns the results in an array. This
array could look like, for example:
np.array([235, 15, 3, 940, 15, ...])The resulting array will have n elements, but could have
duplicated values (15 in the example above), and also
could be sorted differently than reviews. So, the DataFrame
that results from
reviews.loc[np.random.choice(np.arange(n), size=n, replace=True)]
will have the same number of rows as
reviews, but could have duplicated values,
and very well could have a different row order than
reviews.
The average score on this problem was 92%.
reviews.loc[np.random.choice(np.arange(n), size=n, replace=False)]Same number of rows as reviews?
Yes
No
Possibility of duplicated rows? Yes No
Row order guaranteed to be the same as reviews?
Yes
No
reviews?
Yes.reviews?
No.The expression
np.random.choice(np.arange(n), size=n, replace=False)
selects n elements without replacement
from np.arange(n), and returns the results in an array.
Let’s consider what it means to select n items without
replacement from a collection of n items labeled
0, 1, 2, …, n-1. For
example, let n = 5. Then, selecting 5 elements
without replacement from
np.array([0, 1, 2, 3, 4]) could look like:
2. Now there are 4
items left, np.array([0, 1, 3, 4]).3. Now we have 3 items left,
np.array([0, 1, 4]).1. Now we have 2 items left,
np.array([0, 4]).4. Now we have 1 item left,
np.array([0]).0. We’re done!np.array([2, 3, 1, 4, 0]).np.array([2, 3, 1, 4, 0]) is just a
permutation of
np.array([0, 1, 2, 3, 4])!
More generally,
np.random.choice(np.arange(n), size=n, replace=False)
behaves identically to np.random.permutation(np.arange(n)),
so our answer to this part should be the same as our answer to part 2 of
this question. That is,
reviews.loc[np.random.choice(np.arange(n), size=n, replace=False)]
produces a DataFrame that has the same number of rows
as reviews, and does not have any duplicated
rows, but has a different row order than
reviews in all likelihood.
The average score on this problem was 52%.
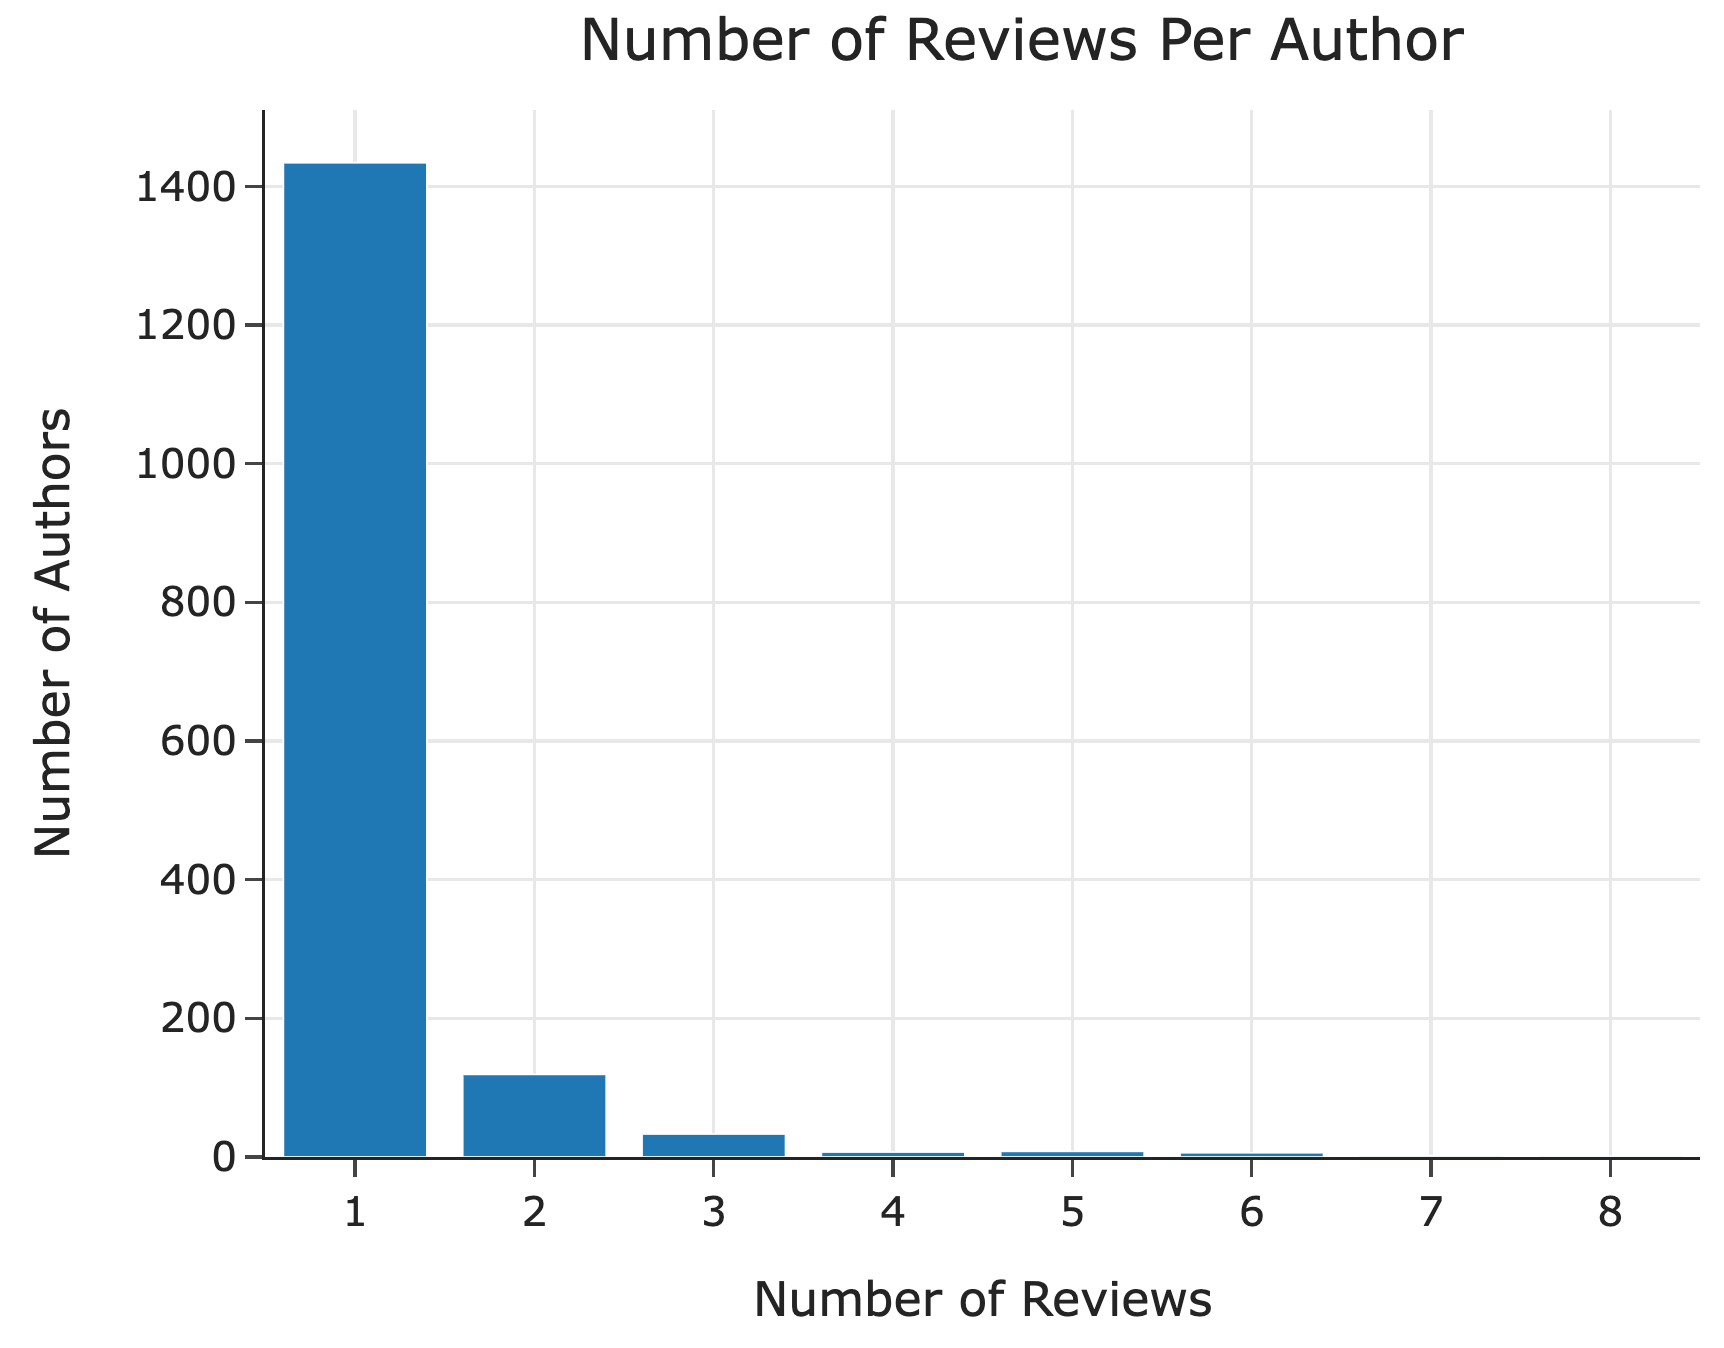
The bar chart below shows the distribution of the number of reviews
per "author" in reviews. For instance, it’s
telling us that approximately 120 "author"s wrote 2
reviews. Assume that the height of the bar at 8 on the x-axis is exactly 1, and that this is the
shortest bar (with no ties).
Hint: The values in the Series that results from
calling value_counts() are sorted in descending order.
Fill in the blank below so that W evaluates to the value
7.
W = reviews["author"].value_counts().__(i)__Answer: There are a few valid answers, namely:
iloc[1].iloc[2].value_counts().index[-2].value_counts().index[6].reviews["author"].value_counts() is a
Series where: - The index contains all of the unique
values in reviews["author"]. - The values contain the
frequencies (i.e. counts) of each value in
reviews["author"].
In other words, reviews["author"].value_counts() tells
us the number of reviews per "author".
What do we know about reviews["author"].value_counts()
from the question?
"author"s that wrote 1 review, the number
of "author"s that wrote 2 reviews, etc."author" wrote 8 reviews, and the
author with the next most reviews was 7.As the question hints to us,
reviews["author"].value_counts() is sorted in decreasing
order of value by default. Putting the information above together, we
know that the first few rows of
reviews["author"].value_counts() looks like:
Most Common Author      8
Someone else            7
A third person          7
...
With that in mind,
reviews["author"].value_counts().iloc[0] would give us 8,
and reviews["author"].value_counts().iloc[1] would give us
7. So, iloc[1] and
iloc[2] are two ways of answering this
part. There are other solutions, but they involve understanding how
reviews["author"].value_counts().value_counts() works,
which we will save for the solution of the next part.
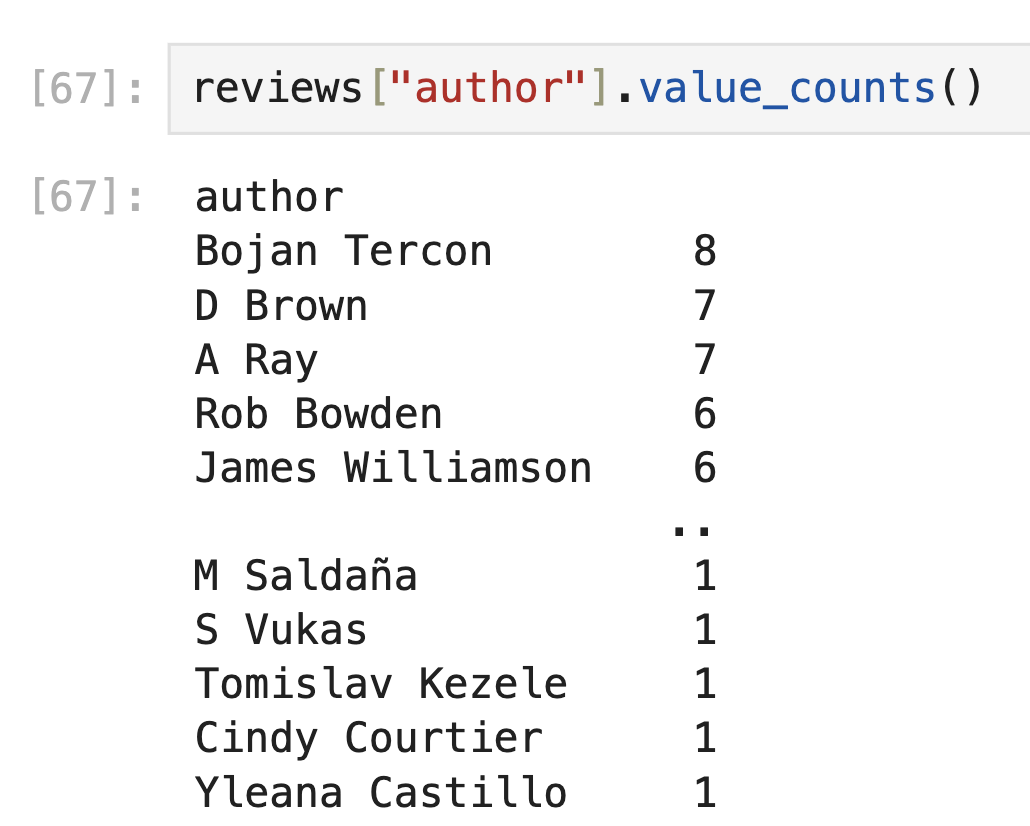
If it’s helpful, here’s what
reviews["author"].value_counts() actually looks like on the
full DataFrame we used to make this exam:
The average score on this problem was 41%.
Now, consider the values defined below.
W = reviews["author"].value_counts().value_counts().loc[1]
X = reviews["author"].value_counts().value_counts().iloc[1]
Y = reviews["author"].value_counts().value_counts().index[1]
Z = reviews["author"].value_counts().value_counts().index[-1]Which value is equal to 8?
W
X
Y
Z
None of these.
Answer:
Z = reviews["author"].value_counts().value_counts().index[-1].
In the solution to the previous part, we understood that
reviews["author"].value_counts() would look something
like:
Most Common Author      8
Someone else            7
A third person          7
...
Then, what does
reviews["author"].value_counts().value_counts() look like?
It’s a Series, too, where:
reviews["author"].value_counts() (so 1, 2, 3, 4, …,
8)."author"s with 1
review, the number of "author"s with 2 reviews, etc.So, reviews["author"].value_counts().value_counts()
actually describes the information in the bar chart provided! It may
look something like:
1           1400
2           120
3           25
5           12
6           9
4           8
7           2
8           1
The only one of these values that we know exactly is in the very last
row, because we’re told that exactly one "author" wrote 8
reviews, the rest wrote fewer. The other values were estimated from the
provided bar chart, but their values are not important in answering any
of the remaining parts of this question.
Keep in mind that the resulting Series is sorted in descending order of value, not by index!
So, we can answer all three remaining parts of this question at once:
reviews["author"].value_counts().value_counts(), so
Z = reviews["author"].value_counts().value_counts().index[-1]
must evaluate to 8.W = reviews["author"].value_counts().value_counts().loc[1]
will give us the value at index 1, which will be the number
of "author"s with 1 review, which is the height of the
first bar.X = reviews["author"].value_counts().value_counts().iloc[1]
will give us the value at integer position 1. Since Python is 0-indexed,
this will give us the second-largest value in
reviews["author"].value_counts().value_counts(), which is
the height of the second-tallest bar, which is indeed what we want.
The average score on this problem was 64%.
Which value is equal to the height of the tallest bar?
W
X
Y
Z
None of these.
Answer:
W = reviews["author"].value_counts().value_counts().loc[1].
See the solution to Part 2.
The average score on this problem was 56%.
Which value is equal to the height of the second-tallest bar?
W
X
Y
Z
None of these.
Answer:
X = reviews["author"].value_counts().value_counts().iloc[1].
See the solution to Part 2.
The average score on this problem was 67%.
Select all visualization techniques we
could use to visualize the distribution of
"overall" ratings, separately for Delta Air Lines and
United Airlines. At least one answer is correct.
side-by-side box plots
side-by-side bar charts
a scatter plot
a pie chart
overlaid histograms
Answer: side-by-side box plots, side-by-side bar charts, overlaid histograms
"overall" ratings are a numerical feature type, and
we’ve learned to visualize the distribution of numerical features using
box plots and histograms.
So, a side-by-side box plot, with one box for Delta Air Lines and one box for United Airlines, would do the job:
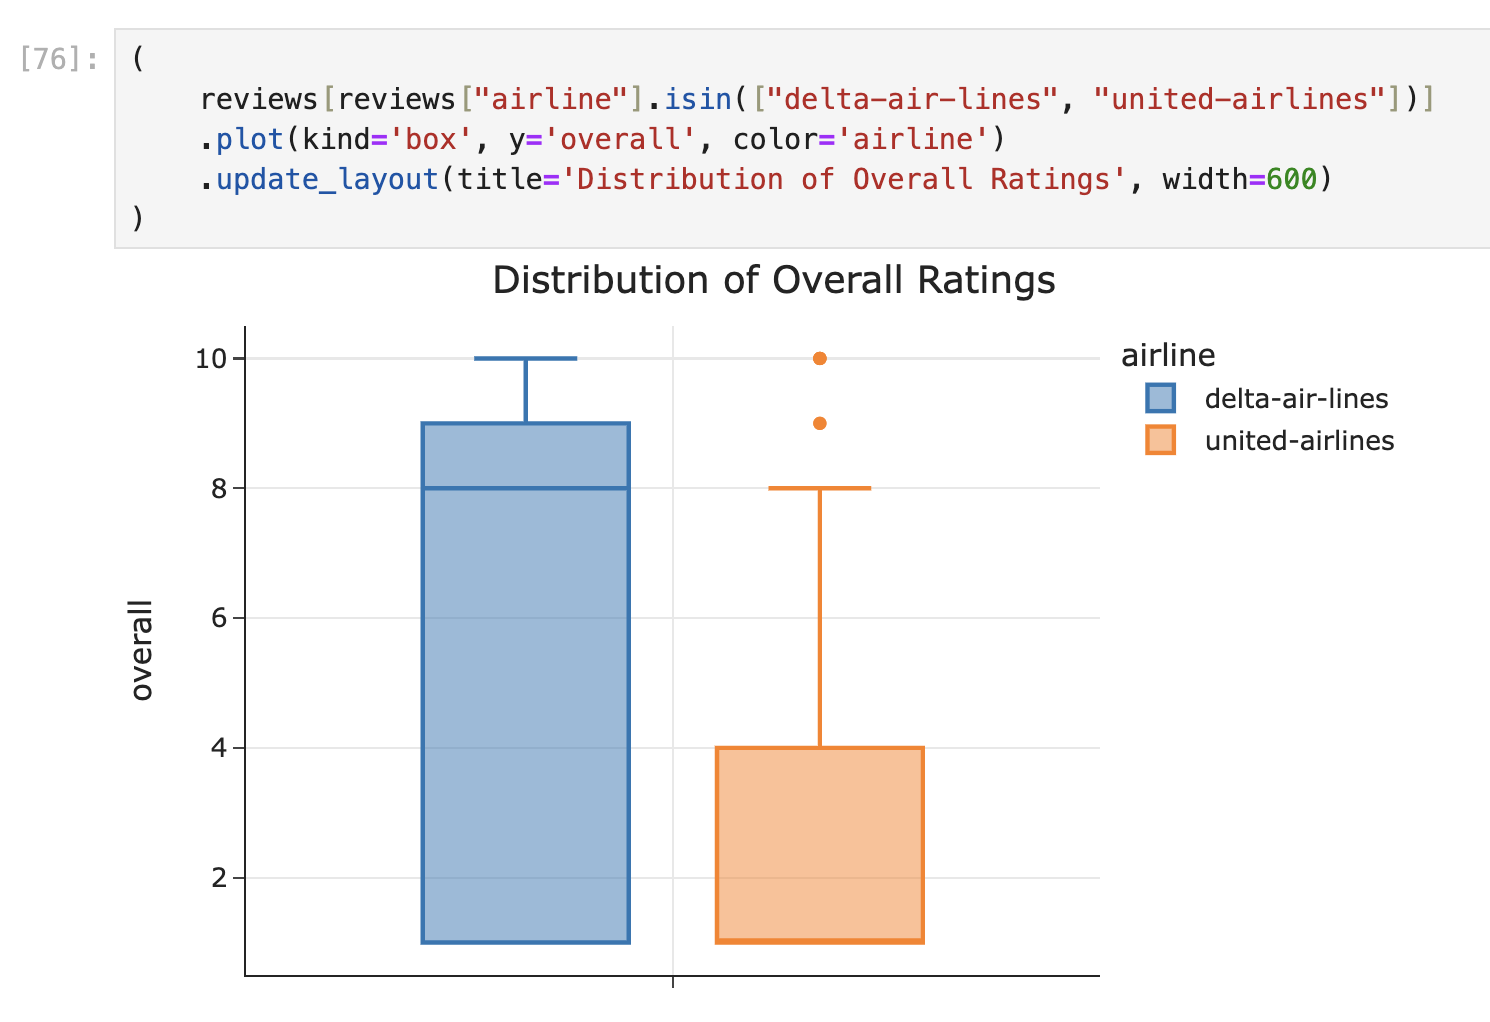
An overlaid histogram would do the job, too: one histogram figure for Delta, one for United.
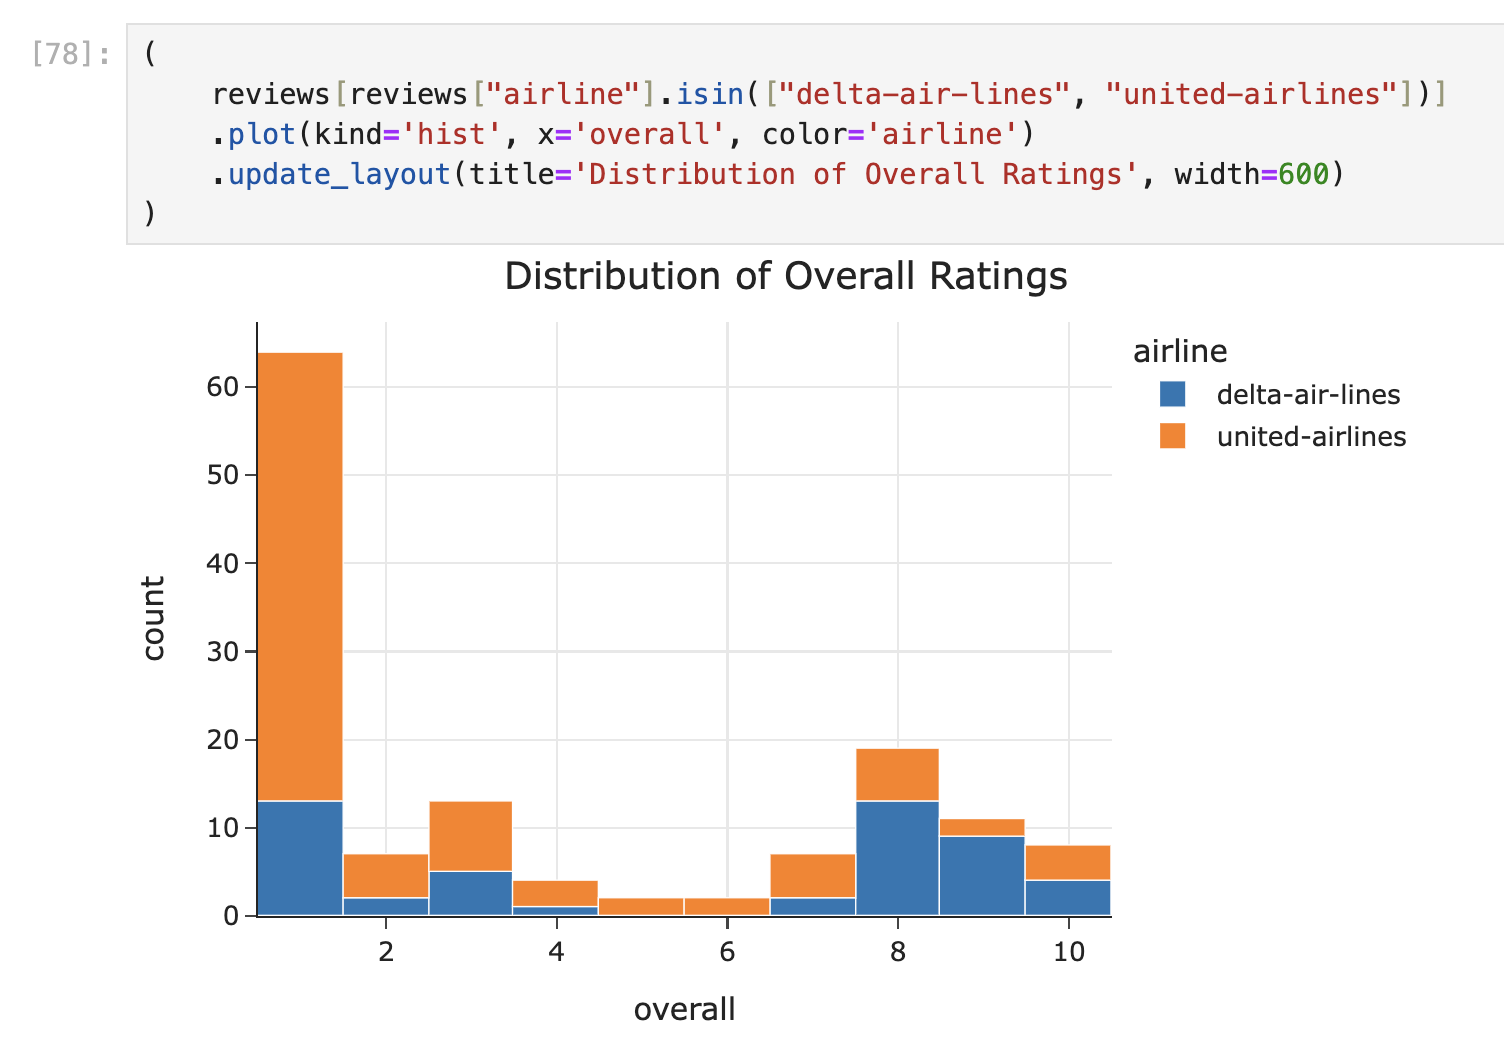
But, there’s a third possibility! Since "overall"
ratings are some integer between 0 and 10, we can also use a bar chart
to describe them. While we didn’t talk about such plots in class
explicitly, a similar one is provided to you in the exam at the start of
Problem 4! There, we show the distribution of a discrete, numerical
feature using a bar chart:

We can do the same thing here, with one bar chart for Delta and one for United, overlaid:
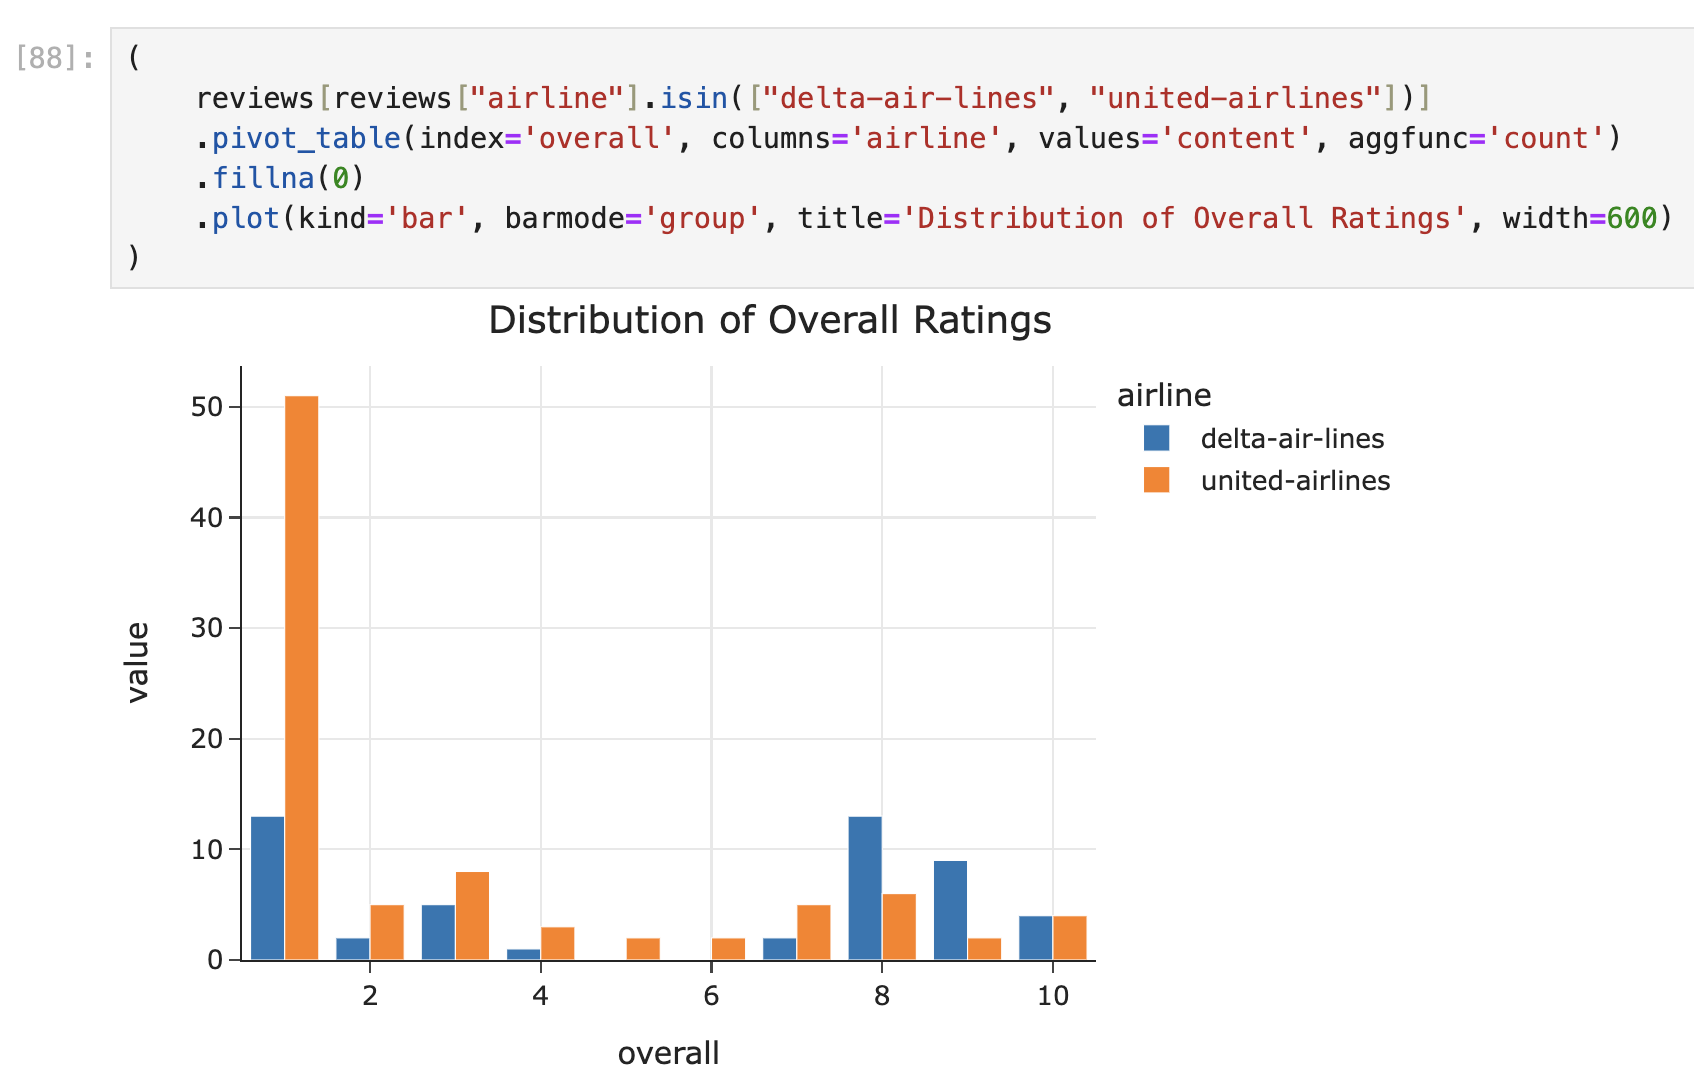
The average score on this problem was 82%.
We define the robust mean of a collection of values to be the mean of all values, once the largest and smallest values are removed. For example, the robust mean of 2, 2, 3, 7, 12 is \frac{2+3+7}{3} = 4.
Fill in the blanks so that worst_robustly evaluates to
the "airline" with the lowest robust mean of
"overall" ratings. Assume there are no ties in robust
ratings, and that each "airline" has at least 3
ratings.
def funky(x):
    return __(iii)__

worst_robustly = reviews.__(i)__["overall"].__(ii)__(funky).idxmin()(i): sort_values("overall")
groupby("overall")
value_counts("overall")
sort_values("airline")
groupby("airline")
value_counts("airline")
(ii): agg
filter
transform
(iii): Free responseAnswer:
    def funky(x):
        return x.sort_values().iloc[1:-1].mean()
        # OR
        return (x.sum() - x.min() - x.max()) / (x.shape[0] - 2)

    worst_robustly = reviews.groupby("airline")["overall"].agg(funky).idxmin()
Let’s look at the problem step-by-step.
"airline" with the
lowest robust mean of "overall" rating. To do so, we need
to first find the robust mean of "overall" ratings for each
"airline". Since we want to perform this calculation
for each "airline", we should
groupby("airline"). (Note that the .idxmin()
at the very end of the expression finds the index of the lowest value in
the preceding Series.)"overall" ratings – which are stored in a Series – and
compute the robust mean of them. This act of taking many
"overall" ratings and condensing them into a single value
is called aggregation, and so the appropriate method here is
agg.funky needs to find the robust mean of
a collection of values. If x is a Series of values, there
are a few ways we can do this:
x, either in ascending or descending order. Then,
remove the first and last value, which will be the min and max if sorted
in ascending order, or the max and min if sorted in descending order
(either way, it doesn’t change the result). Then, extract all of the
remaining values and take the mean of them.
x.sort_values().iloc[1:-1] gets the values we need to take
the mean of, and x.sort_values().iloc[1:-1].mean() returns
what we want.x.sum() - x.min() - x.max(), and the number of values –
again, with the min and max removed – is x.shape[0] - 2,
which means that
(x.sum() - x.min() - x.max()) / (x.shape[0] - 2) also
returns the robust mean.
The average score on this problem was 86%.
What are the input and output types of the function
funky?
Input: Series, Output: Number
Input: Series, Output: Series
Input: Series, Output: DataFrame
Input: DataFrame, Output: Number
Input: DataFrame, Output: Series
Input: DataFrame, Output: DataFrame
Answer: Input: Series, Output: Number
Let’s take a look at the expression below:
reviews.groupby("airline")["overall"].agg(funky).idxmin()reviews.groupby("airline")["overall"] is a SeriesGroupBy
object, meaning that funky is called on various
Series. Specifically, it is called on a Series of
"overall" scores, separately for each
"airline". The output of funky is a single
number, since it’s an aggregation method that takes lots of values
(numbers) and condenses them into a single value (number).
The average score on this problem was 52%.
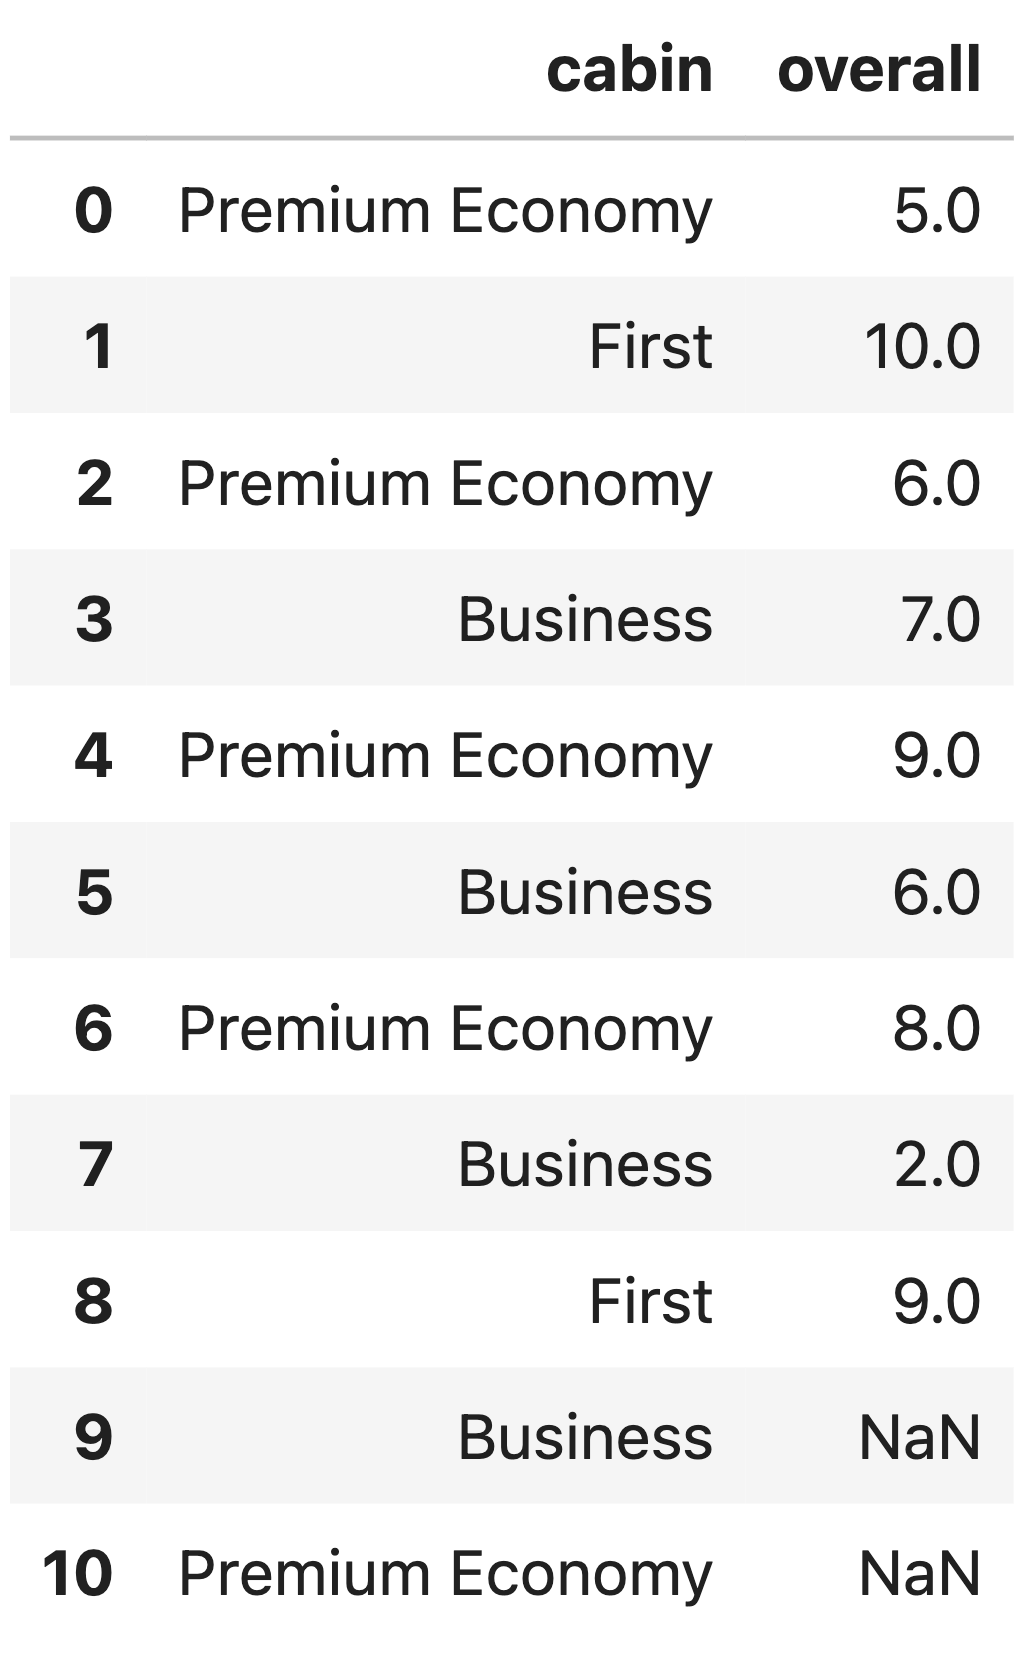
Consider the DataFrame imp, shown in its entirety
below.
As in the previous question, we define the robust mean of a collection of values to be the mean of all values, once the largest and smallest values are removed. For example, the robust mean of 2, 2, 3, 7, 12 is \frac{2+3+7}{3} = 4.
Suppose we use robust mean imputation, conditional on
"cabin" to fill in the missing values in the
"overall" column. In doing so, what are the missing values
in the "overall" column filled in with? Give your answers
as numbers.
Answer:
9: 6 (or 6.0)10: 7 (or 7.0)To perform robust mean imputation, conditional on
"cabin", we must fill each missing "overall"
value with the robust mean of the observed "overall" values
with the same "cabin" as the missing value. So:
9 has a "cabin"
of Business. The observed "overall" values for Business are
7, 6, and 2. The robust mean of 7, 6, and 2 is just 6, since when you
remove the min (2) and max (7) you’re left with just a single value, 6,
and the mean of a single value is that one value. So, we fill in the
missing value in row 9 with 6.10 has a "cabin"
of Premium Economy. The observed "overall" values for
Premium Economy are 5, 6, 9, and 8, and the robust mean of these values
is \frac{6 + 8}{2} = 7, which is the
mean once the min (5) and max (9) are removed. So, we fill in the
missing value in row 10 with 7.
The average score on this problem was 90%.
Suppose imp represents the DataFrame above, with 2
missing values, and filled represents the DataFrame that
results from imputing the missing values in imp in the way
described in the previous part. In the following code block, what is the
value of comp?
  old_means = imp.groupby("cabin")["overall"].mean()
  comp = old_means == filled.groupby("cabin")["overall"].mean()
True
False
The Series [True, True, True]
The Series [False, False, False]
The Series [True, True, False]
The Series [True, False, True]
The Series [False, True, True]
The Series [False, False, True]
The Series [False, True, False]
The Series [True, False, False]
Hint: When grouping, the index is automatically sorted in ascending order.
Answer: The Series
[False, True, True]
old_means is a Series containing the mean
"overall" score of each "airline", before we
fill in any missing values (i.e. with missing values ignored), and
filled.groupby("cabin")["overall"].mean() is a Series
containing the mean "overall" score of each
"airline" post-imputation. The index of both of these
Series is ["Business", "First", "Premium Economy"], since
when grouping and aggregating, the index is set to the unique values in
the grouped-on column ("cabin", here) in ascending
order.
So, this question boils down to checking whether the means of each group changed because of the imputation we did.
So, the Business mean changed, while the First and Premium Economy
means did not change. In the order
["Business", "First", "Premium Economy"] that we
established above, our comparisons are [False, True, True],
and so comp is a Series of
[False, True, True].
The average score on this problem was 46%.
Consider the DataFrame framer, defined below.
framer = reviews.pivot_table(index="airline",
                                columns="cabin",
                                values="author",
aggfunc="max")In one English sentence, describe the meaning of the value that the following expression evaluates to.
framer.loc["emirates", "Economy"]Answer: The last name, alphabetically, among all authors who submitted an Economy Class Emirates review.
framer might look something like this:
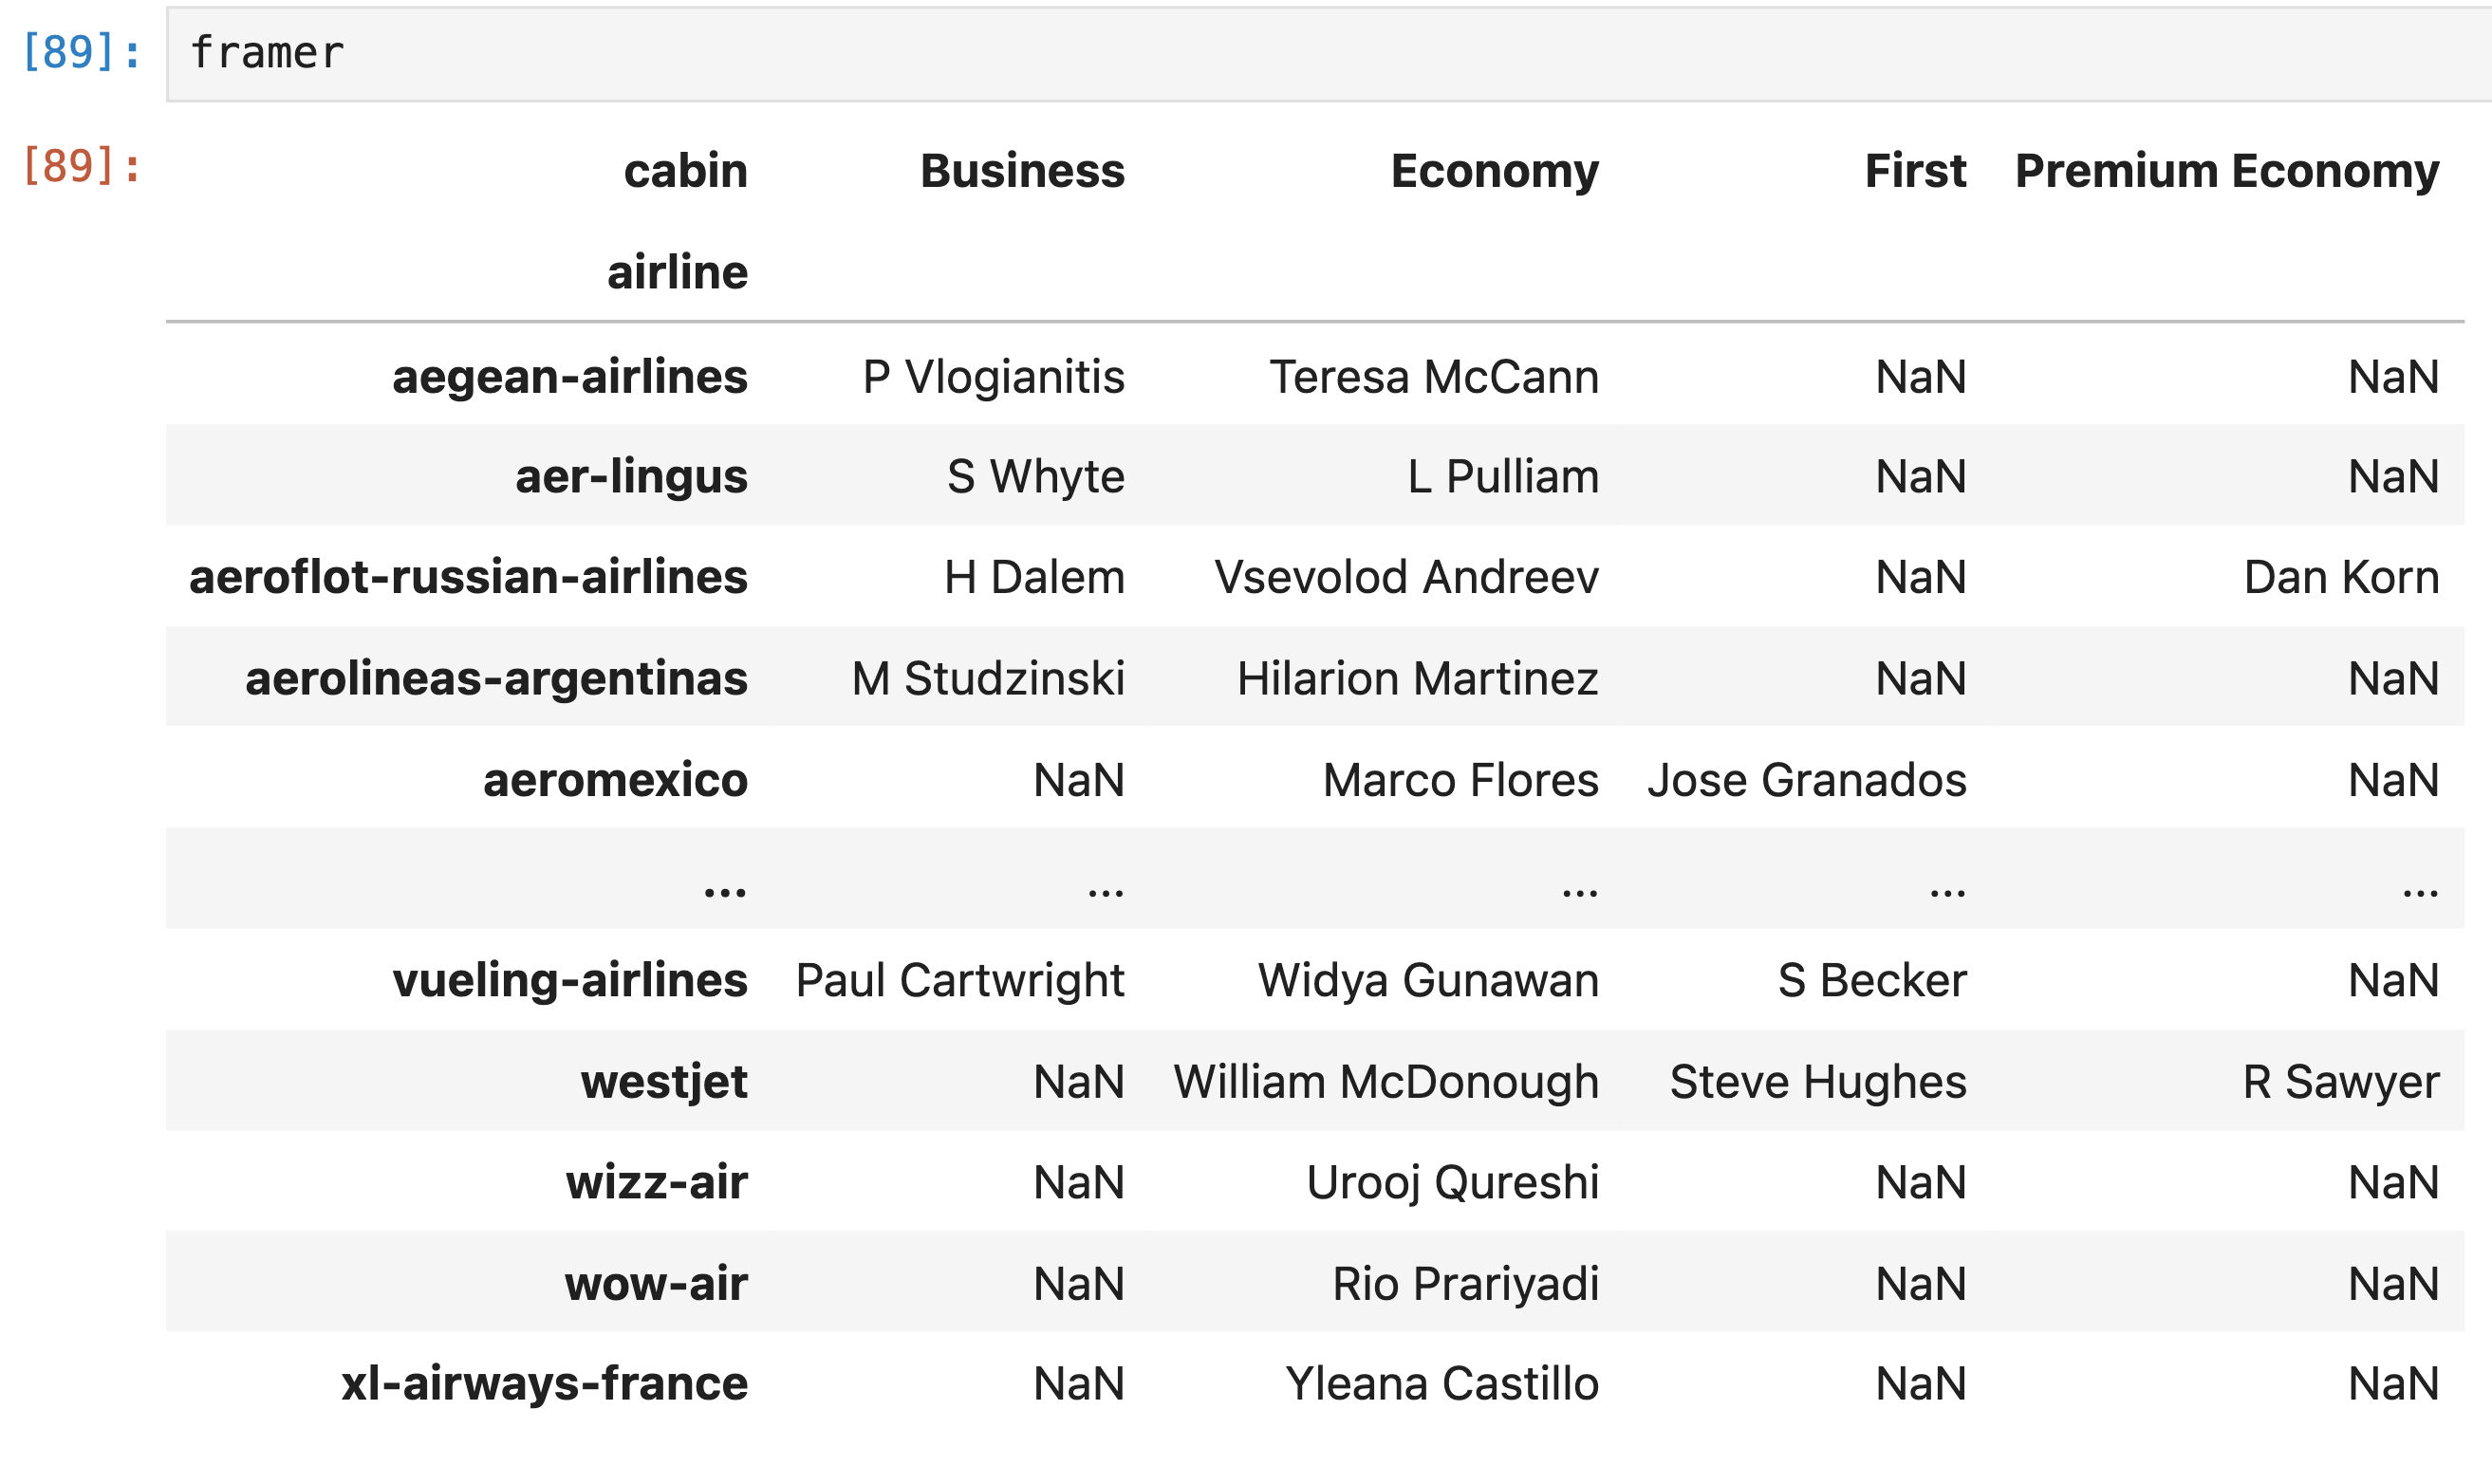
The rows of framer are the unique
"airline"s and the columns of framer are the
unique "cabin"s. The value in row a and column
c is the maximum "author" who wrote a review
for "airline" a in "cabin"
c. Since "author" names are strings, the
“maximum” "author" name is the last alphabetically (or
lexicographically).
The average score on this problem was 73%.
What is the value of the following expression?
framer.isna().sum(axis=0).shape[0] The number of unique values in the "airline" column of
reviews.
The number of unique values in the "cabin" column of
reviews.
The number of unique values in the "author" column of
reviews.
The number of unique values in the "overall" column of
reviews.
None of the above.
Answer: The number of unique values in the
"cabin" column of reviews.
Let’s walk through the logic:
framer has one column per unique "cabin"
in reviews.framer.isna() is a DataFrame with the same shape as
framer, with each value either being True (if
the corresponding value in framer is null) or
False.framer.isna().sum(axis=0) computes the sum across the
rows, which is the sum of each column of
framer.framer.isna().sum(axis=0) has one entry
per column in framer, i.e. one entry per unique
"cabin" in reviews.framer.isna().sum(axis=0).shape[0] is equal to the
number of unique values in the "cabin" column of
reviews.
The average score on this problem was 17%.
Consider the following information.
>>> framer.isna().sum(axis=0).sum()
320
>>> reviews["airline"].nunique()
125
>>> reviews["cabin"].nunique()
4
What is the value of the following expression? Show your work, and \boxed{\text{box}} your final answer, which should be a positive integer.
reviews.groupby(["airline", "cabin"])["overall"].mean().shape[0]Answer: 180.
Let
grouped = reviews.groupby(["airline", "cabin"])["overall"].mean(),
the DataFrame provided in the question. grouped has one row
for every unique combination of "airline" and
"cabin" that actually appears in reviews.
Since there are 125 unique values of "airline" and 4 unique
values of "cabin", there are 125
\cdot 4 = 500 possible unique combinations of
"airline" and "cabin".
But, these combinations don’t all actually exist in
grouper! The fact that
framer.isna().sum(axis=0).sum() is 320 means
that there are 320 missing values in framer, total.
framer, too, has 125 rows and 4 columns, since it results
from calling
reviews.pivot_table(index="airline", columns="cabin"). But,
since it has 320 missing values, it means that 320 of the possible
combinations of "airline" and "cabin" never
actually appeared in reviews.
So, the number of combinations of "airline" and
"cabin" that actually appeared in reviews is
equal to the number of non-null values in framer – or,
equivalently, the number of rows in grouped (so
grouped.shape[0]), which is the answer to the question
we’re looking for – is:
125 \cdot 4 - 320 = \boxed{180}
The average score on this problem was 61%.
Consider the DataFrame lines, created by keeping the
rows in reviews corresponding to reviews written between
2015-11-24 and 2015-11-28. Remember, each row in lines
corresponds to a review of an airline.
Also consider the DataFrame ports, in which each row
corresponds to a review of a particular airport.
ports has a "date" column, too, and also only
has reviews written between 2015-11-24 and 2015-11-28.
Consider the following information.
>>> lines["date"].value_counts().sort_index()
2015-11-24      2
2015-11-25      7
2015-11-26      1
2015-11-27      4
>>> ports.shape[0]
17
>>> ports["date"].unique()
array(["2015-11-26", "2015-11-27", "2015-11-28"])
>>> lines.merge(ports, on="date", how="inner").shape[0]
29
>>> lines.merge(ports, on="date", how="outer").shape[0]
41
Below, give your answers as integers.
How many values in ports["date"] are equal to
"2015-11-24"?
Answer: 0.
Since ports["date"].unique() evaluates to
array(["2015-11-26", "2015-11-27", "2015-11-28"]), we know
that none of the values in ports["date"] are
"2015-11-24".
The average score on this problem was 83%.
How many values in ports["date"] are equal to
"2015-11-25"?
Answer: 0.
Since ports["date"].unique() evaluates to
array(["2015-11-26", "2015-11-27", "2015-11-28"]), we know
that none of the values in ports["date"] are
"2015-11-25".
The average score on this problem was 83%.
How many values in ports["date"] are equal to
"2015-11-26"?
Answer: 9.
Let:
ports["date"] equal to
"2015-11-26" be a,ports["date"] equal to
"2015-11-27" be b,
andports["date"] equal to
"2015-11-28" be c.Then, a, b, and c are the answers to parts 3, 4, and 5 of this question, respectively.
To solve for a, b, and c, we’ll need to put together several pieces of information:
ports.shape[0] is 17, the total
number of values in ports["date"] is 17. We know, from the
fact that ports["date"].unique() is
array(["2015-11-26", "2015-11-27", "2015-11-28"]), that the
only values in ports["date"] are "2015-11-26",
"2015-11-27", and "2015-11-28". This means
that a + b + c = 17 – we’ll call this
equation 1.lines and ports on "date". The
only unique values that are shared between lines["date"]
and ports["date"] are "2015-11-26" (1 in
lines, a in
ports) and "2015-11-27" (4 in
lines, b in
ports). So, because of the fact that: \underbrace{\text{frequency}(\text{value},
\texttt{merged(lines, dates)} = \text{frequency}(\text{value},
\texttt{lines}) \cdot \text{frequency}(\text{value},
\texttt{dates})}_{\text{this is not a formula we saw explicitly in
class; rather, it's a principle we used repeatedly when solving
number-of-rows-in-merges problems}} We have our equation 2: 1a + 4b = 29lines and ports on "date". The
rows in the result of the outer merge are all 29 rows of the inner
merge, plus one row each for each row that was in lines or
dates without an overlapping "date". So,
equation 3 is: \underbrace{29}_{\text{inner
merge}} + \underbrace{2 + 7}_{\text{the frequencies of
\texttt{"2015-11-24"} and \texttt{"2015-11-25"} in
\texttt{lines}}} + \underbrace{c}_\text{the frequency of
\texttt{"2015-11-28"} in \texttt{ports}} = 41So, our three equations are:
\begin{align} a + b + c &= 17\\ a + 4b &= 29\\ 29 + 2 + 7 + c &= 41\end{align}
Let’s work our way to a solution.
So, a = 9, b = 5, and c = 3, meaning that:
ports["date"] equal to
"2015-11-26" is 9,ports["date"] equal to
"2015-11-27" is 5, andports["date"] equal to
"2015-11-28" is 3.
The average score on this problem was 52%.
How many values in ports["date"] are equal to
"2015-11-27"?
Answer 5.
See the solution to part 3.
The average score on this problem was 55%.
How many values in ports["date"] are equal to
"2015-11-28"?
Answer 3.
See the solution to part 3.
The average score on this problem was 65%.
This question is not in scope for Winter 2025.
Consider the following SQL query.
    SELECT author, AVG(overall) AS average_overall FROM reviews
    GROUP BY author
    HAVING AVG(overall) >= 8 AND COUNT(*) >= 5
    ORDER BY average_overall;
Now, consider the following four code blocks.
    f = lambda x: x["overall"].mean() >= 8 and x.shape[0] >= 5
    pop_auth = (reviews.groupby("author").filter(f)
                        .groupby("author")[["overall"]].mean()
.sort_values("overall").reset_index()) g = lambda x: x.shape[0] >= 5
pop_auth = (reviews[reviews["overall"] >= 8]
.groupby("author").filter(g)
.groupby("author")[["overall"]].mean()
.sort_values("overall").reset_index()) pop_auth = (reviews["author"].value_counts().reset_index()
.merge(
reviews.groupby("author")[["overall"]].mean().reset_index(),
on="author")
.pipe(lambda x: x[(x["overall"] >= 8)])
.sort_values("overall")
.pipe(lambda r: r[r["count"] >= 5])
[["author", "overall"]]) temp = reviews.groupby("author")["overall"].agg(["count", "mean"])
pop_auth = (temp[(temp["count"] >= 5) & (temp["mean"] >= 8)]
.sort_values("mean")
.reset_index()[["author", "mean"]])Three of the blocks above correctly assign pop_auth to a
DataFrame that is equivalent to the table outputted by the SQL query at
the top of the page (ignoring the names of the resulting columns and the
values in the index). One of the options is
incorrect.
Which block is incorrect – that is, which block
does not assign pop_auth so that it is
equivalent to the result of the SQL query at the top of the page?
Block 1
Block 2
Block 3
Block 4
Answer: Block 2
The provided SQL query finds the name and average
"overall" rating given by all "author"s who
wrote at least 5 reviews and gave an average "overall"
rating of at least 8. Blocks 1, 3, and 4 do this.
The issue with Block 2 is that it first queries for
just the rows where the "overall" rating is over 8 before
grouping, using reviews[reviews["overall"] >= 8]. After
this (pandas) query, we’ve totally lost all of the rows
with an "overall" rating below 8. It’s very possible for
"author"s to have an average "overall" rating
above 8 but have written some reviews with an
"overall" rating below 8, which means that the resulting
DataFrame in Block 2 could have incorrect average "overall"
ratings for some "author"s. It could even be missing some
"author"s entirely.
For example, suppose we have two "author"s, A and B, who
gave out the following "overall" ratings:
Both A and B meet the criteria to be included in the the output
DataFrame – they have written at least 5 reviews and have an average
"overall" rating of at least 8. But, after querying out all
of the rows with an "overall" rating under 8, B is reduced
to just having the 4 values 8, 9, 10, 10. Since B no longer fits the
criteria in filter(g), it won’t be included in the
output.
The average score on this problem was 73%.
Suppose we define soup to be a BeautifulSoup object that
is instantiated using the HTML document below. (To save space, we’ve
omitted the tags <html> and
</html>.)
<title>Aalborg Airport Customer Reviews - SKYTRAX</title>
<a href="https://www.airlinequality.com" rel="nofollow">
    <img src="https://www.airlinequality.com/images/skytrax.svg" alt="SKYTRAX">
</a>
<div class="skytrax-ratings">
    <table class="review-ratings">
        <tr>
            <td class="terminal-cleanliness">Terminal Cleanliness</td>
            <td>4</td>
        </tr>
        <tr>
            <td class="food-beverages">Food Beverages</td>
            <td>9</td>
        </tr>
        <tr>
            <td class="airport-staff">SKYTRAX Staff</td>
            <td>3</td>
        </tr>
    </table>
</div>
In parts 1 and 2, fill in the blanks so that each expression
evaluates to "SKYTRAX".
soup.__(i)__("alt")Answer:
soup.find("img").get("alt")The existing "alt" argument tells us that we’re looking
to extract the alt attribute’s value from this tag:
<img src="https://www.airlinequality.com/images/skytrax.svg" alt="SKYTRAX">The tag containing this attribute is the very first img
tag in the document, so soup.find("img") will navigate to
this tag. To access the value of this tag’s img attribute,
we use .get("alt") on the tag, so putting it all together,
we have soup.find("img").get("alt").
The average score on this problem was 64%.
soup.find("td", __(i)__).text.__(ii)__Answer:
soup.find("td", class_="airport-staff").text.split()[0]or
soup.find("td", attrs={"class": "airport-staff"}).text[:7]or some combination.
Here, we’re told the information we’re looking for must be in some
td tag. There’s only one td tag that contains
"SKYTRAX" anywhere, and it’s this one:
<td class="airport-staff">SKYTRAX Staff</td>To navigate to this td tag specifically, we can ask for
a td tag whose class attribute is
"airport-staff". Two ways to do that are:
soup.find("td", class_="airport-staff")soup.find("td", attrs={"class": "airport-staff"})Once we’ve navigated to that tag, its text attribute
evaluates to "SKYTRAX Staff" (the text
attribute of a tag gives us back all of the text between
<tag> and </tag>). Then, it’s a
matter of extracting "SKYTRAX" from
"SKYTRAX Staff", which can either be done by:
soup.find("td", class_="airport-staff").text.split()[0],
orsoup.find("td", class_="airport-staff").text[:7].
The average score on this problem was 82%.
Fill in the blanks so that avg_rating evaluates to the
mean of the three ratings in the document above. (In the document, the
three ratings are 4, 9, and 3, but you shouldn’t
hard-code these values.)
texts = [tag.text for tag in soup.find_all("td")]
avg_rating = np.mean([__(i)__ for j in range(__(ii)__)])Answer:
avg_rating = np.mean([int(texts[j]) for j in range(1, 6, 2)])texts evaluates to a list containing the text between
each td tag, all as strings. Here, that would be:
texts = ["Terminal Cleanliness", "4", "Food Beverages", "9", "SKYTRAX Staff", "3"]The purpose of the list comprehension in the second line,
[__(i)__ for j in range(__(ii)__)], is to extract out just
the numbers from this list.
range(1, 6, 2) evaluates to a list (technically, a range
object) with the values [1, 3, 5], so iterating over
range(1, 6, 2) will allow us to access the positions of
each number.[j for j in range(1, 6, 2)] gives us
[1, 3, 5], and
[texts[j] for j in range(1, 6, 2)] gives us
["4", "9", "3"].texts[j] value either to an int or float.
int(texts[j]) does this for us. Putting all steps together
gives us:[int(texts[j]) for j in range(1, 6, 2)]Note that a common incorrect answer was:
[texts[j].astype(int) for j in range(1, 6, 2)]But, astype is a Series method, meaning that whatever
comes before .astype(int) must be a Series, and each
individual texts[j] value is a single string, not a Series
of strings.
The average score on this problem was 48%.
All airports have IATA codes, which are strings of three uppercase
letters that uniquely identify the airport. For example, Detroit’s IATA
code is "DTW". Many of the entries in the
"content" column of reviews use IATA codes to
describe the route flown.
We define a route string as being a pair of IATA
codes separated by "-" or " to " (pay close
attention to the spacing). For example, in test_review
there are two route strings, "YWG-LHR" and
"EDI to YWG":
test_review = """I recently traveled YWG-LHR and returned home from
                    EDI to YWG with AC Rouge. I must say I was
                    pleasantly surprised with how well the trip went
                    in both directions, but I'm glad I didn't have to
                    transit in ORD."""
Write a regular expression that matches valid route strings.
Answer: [A-Z]{3}( to |-)[A-Z]{3}
Interact with the solution on regex101 at this link:

Here, we need to match all sequences with:
[A-Z]{3}, followed
by" to " or "-", matched by
( to |-), followed by[A-Z]{3}.Some refreshers:
[A-Z] character class matches any uppercase
letter.( to |-), the spaces and - are
literals, and | is the “or” operator. Parentheses are
needed so that the “or” operation only applies to to and
-, not everything before and after the |.
The average score on this problem was 91%.
Consider the string thoughts, defined below:
thoughts = """Brought my Sony A5000 for my trip
                the Airbus A220v300's bathroom has a window
                My favorite jet is the B737-900ER flew it like x 239
                all stan the queen B747, 120% the B333st
                I like the chonky A380
                but I love the A350"""
There are exactly 5 valid plane codes in
thoughts: "A220", "B737",
"B747", "A380", and "A350". For
each regular expression exp below,
re.findall(exp, thoughts) extracts in their entirety,
andre.findall(exp, thoughts) also extracts.The first example has been done for you.
exp = r"B\d{3}"Even though the answer was already provided for you, we’ve illustrated it here:
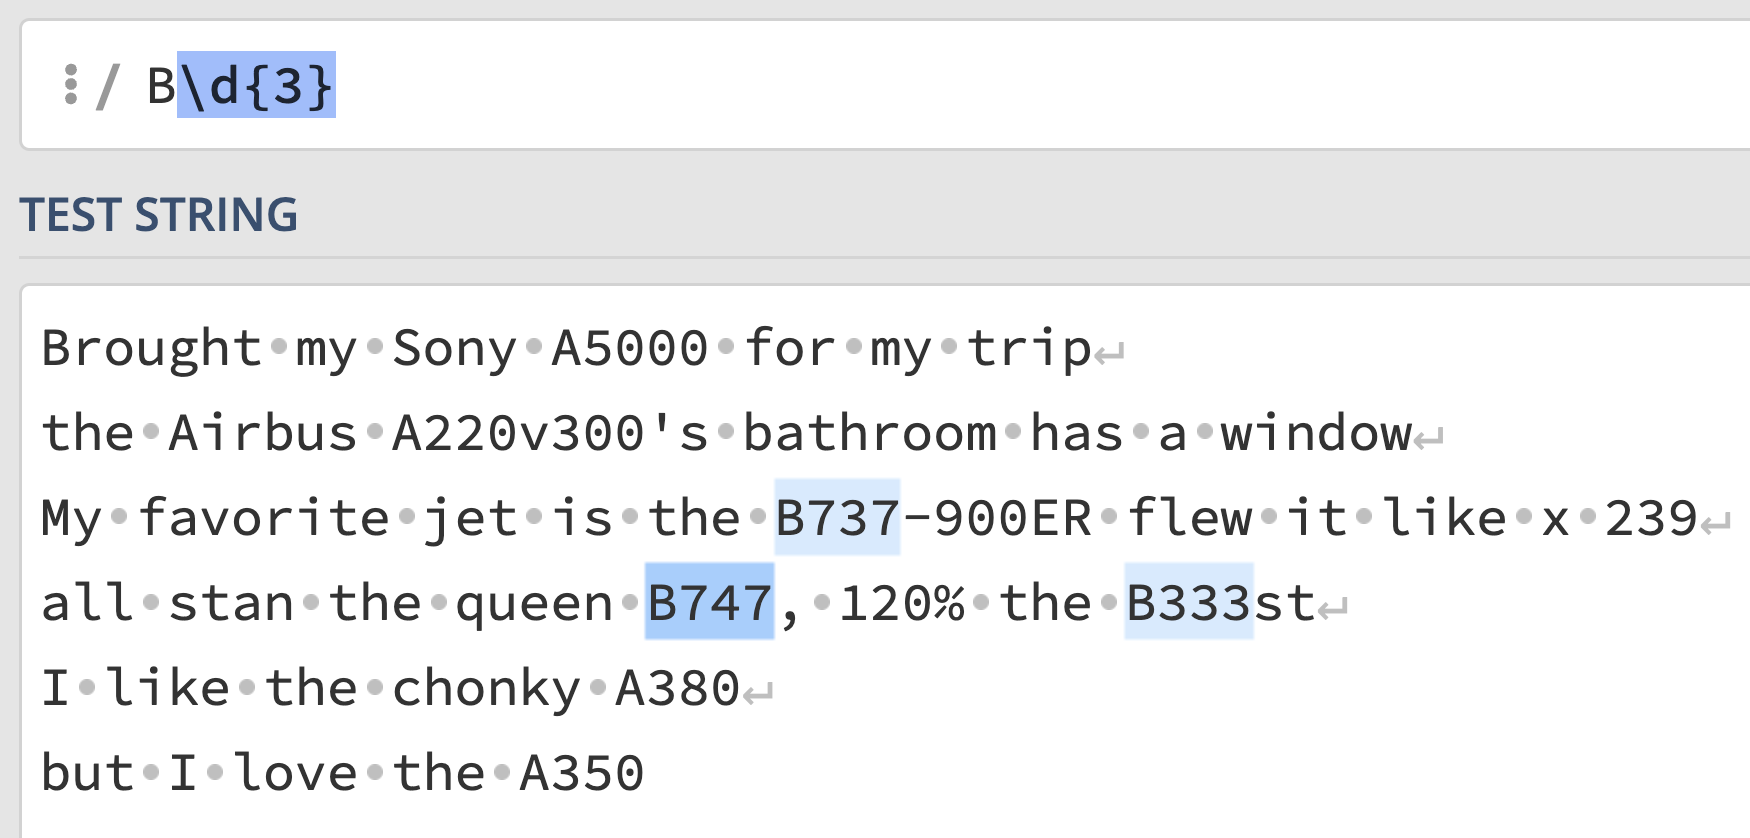
The regular expression says, match any sequence of characters with a
"B" followed by any three digits. This correctly captures
"B737" and "B747", but incorrectly captures
"B333" in line 4, which is not a valid plane code.
Interact with the regular expression on regex101 at this link.
exp = r"[AB]\d{3}"The regular expression says, match any sequence of characters with an
"A" or "B" followed by any three digits. This
correctly captures all 5 plane codes, but also matches
"A500" in line 1 and "B333" in line 4.
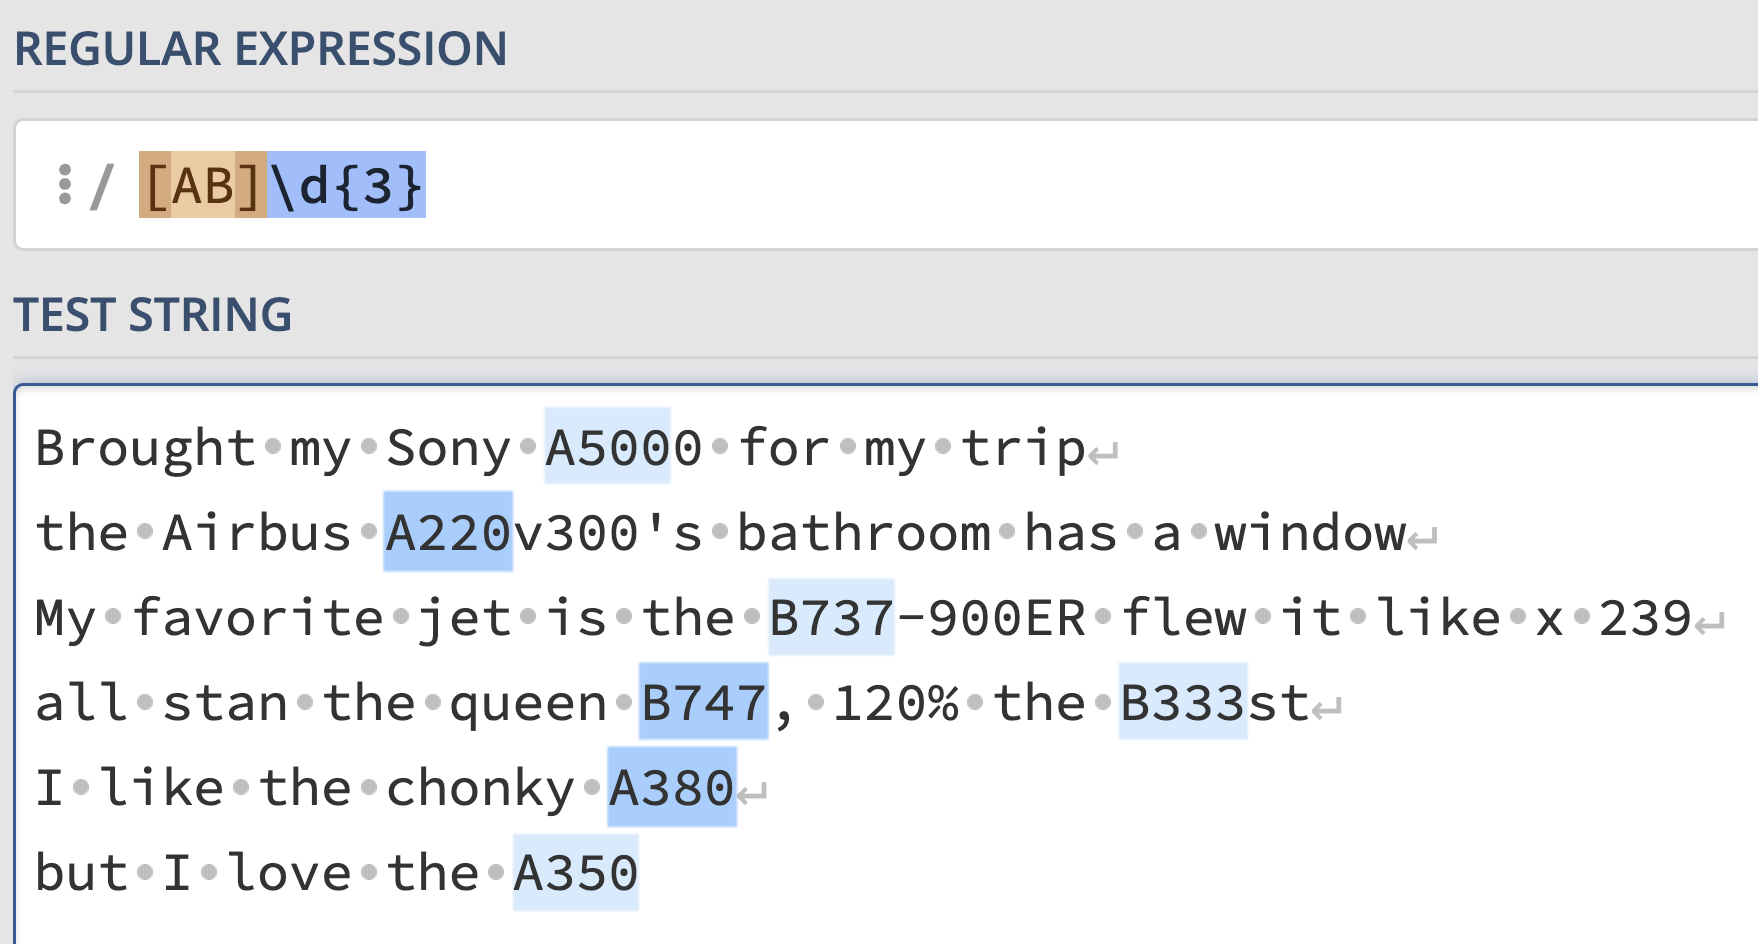
Interact with the solution on regex101 at this link.
The average score on this problem was 84%.
exp = r"A\d{2}0|B7\d7"Answer:
This regular expression says, match any sequence that either looks like:
"A", followed by any two digits, followed
by a "0", or"B", followed by a "7",
followed by any digit, followed by another "7".This correctly captures all 5 plane codes, but also matches
"A500". Unlike the previous regular expression, it doesn’t
match "B333".
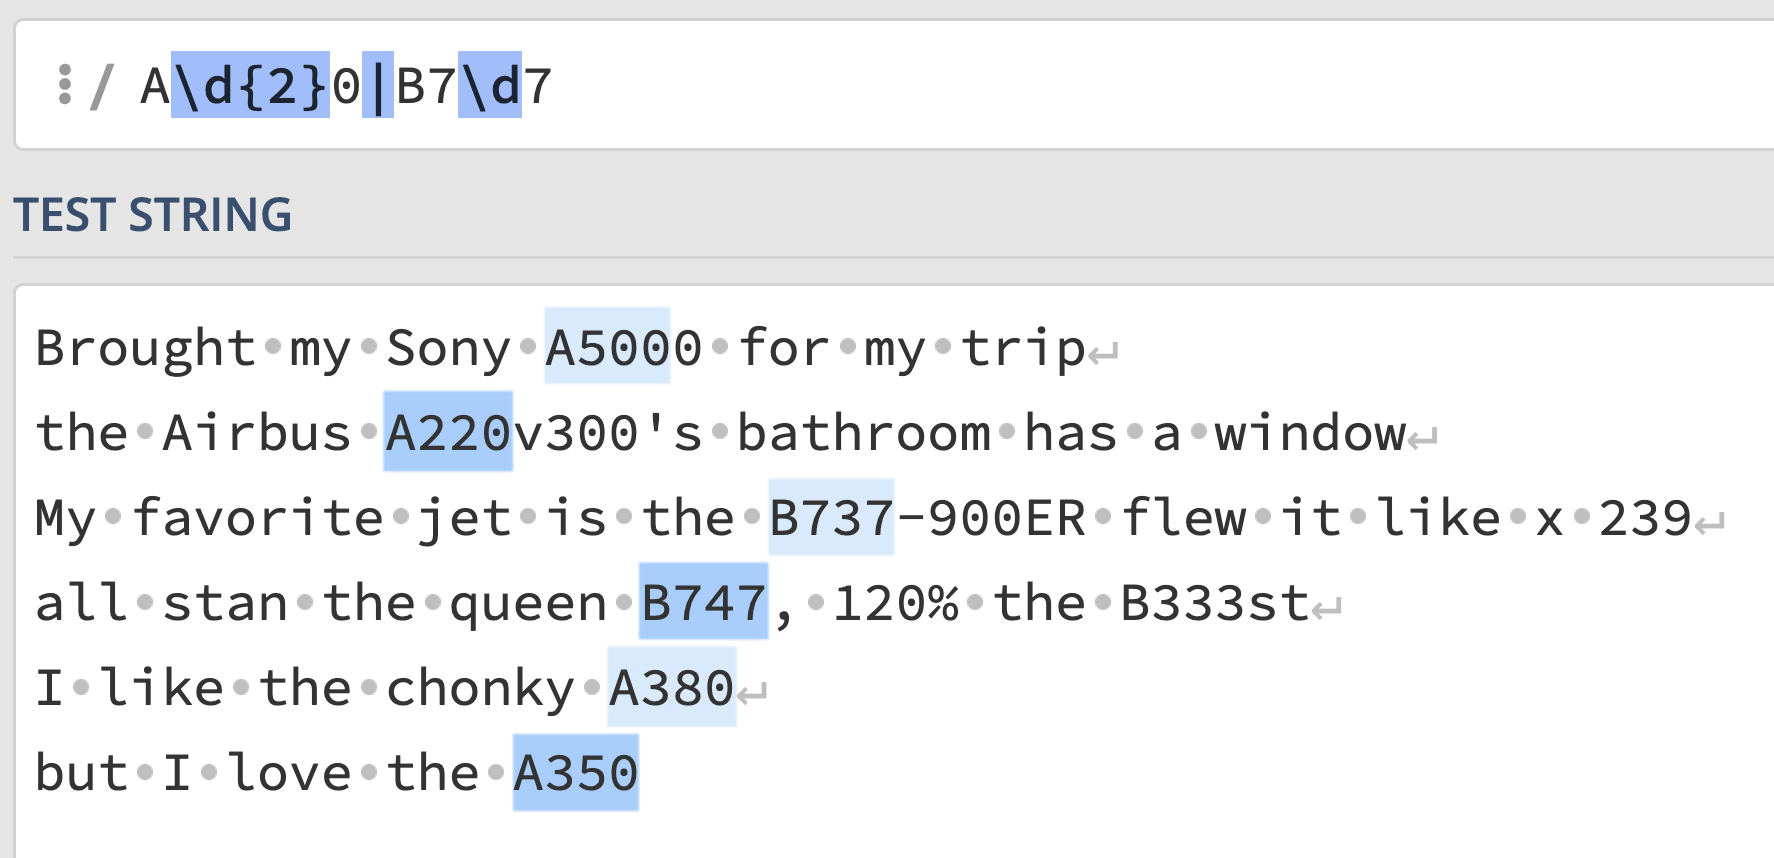
Interact with the solution on regex101 at this link.
The average score on this problem was 80%.
exp = r"A[23]\d0|B7\d7"Answer:
This regular expression says, match any sequence that looks like:
"A", followed by either a
"2" or a "3", followed by any digit, followed
by a "0", or"B", followed by a "7",
followed by any digit, followed by another "7".This correctly captures all 5 plane codes, and nothing else!
"B333" still isn’t matched, and "A500" isn’t
matched either, because we’ve required that the digit right after
"A" must either be "2" or "3",
disqualifying the "5" in "A500".
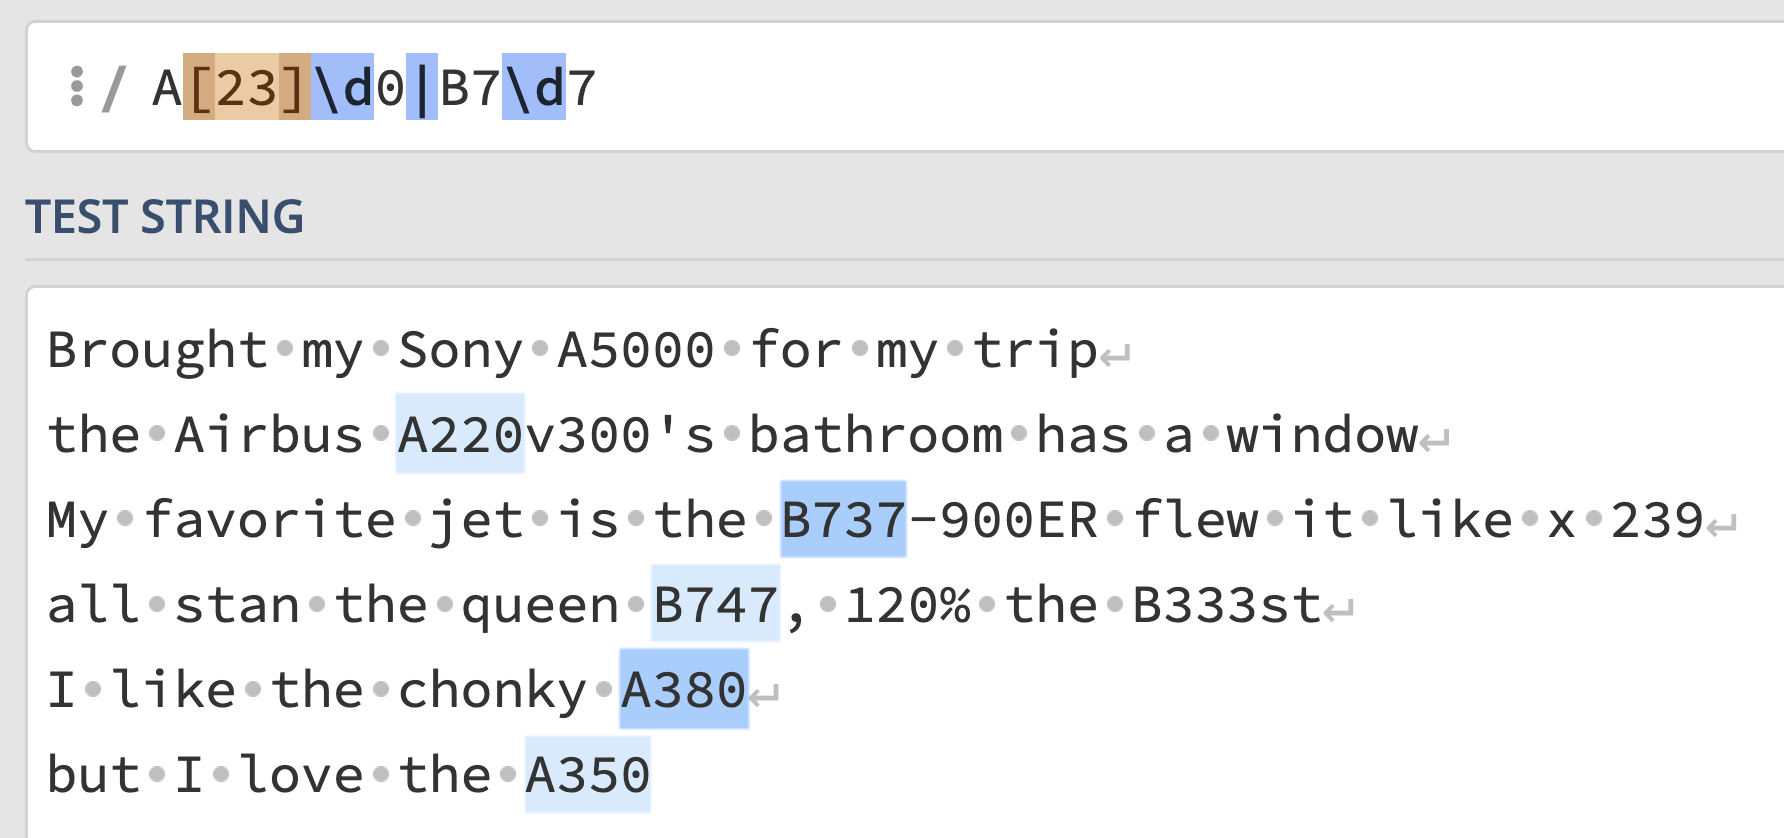
Interact with the solution on regex101 at this link.
The average score on this problem was 79%.
exp = r"(A[23]\d0|B7\d7)$"Answer:
The difference between this regular expression and the last one is
the anchor at the end, $. This requires the pattern being
matched to be at the end of a line. While are 5 valid plane codes in
thoughts, only two are at the end of their respective
lines: "A380" in line 5 and "A350" in line 6.
So, those are the only two plane codes that are matched.
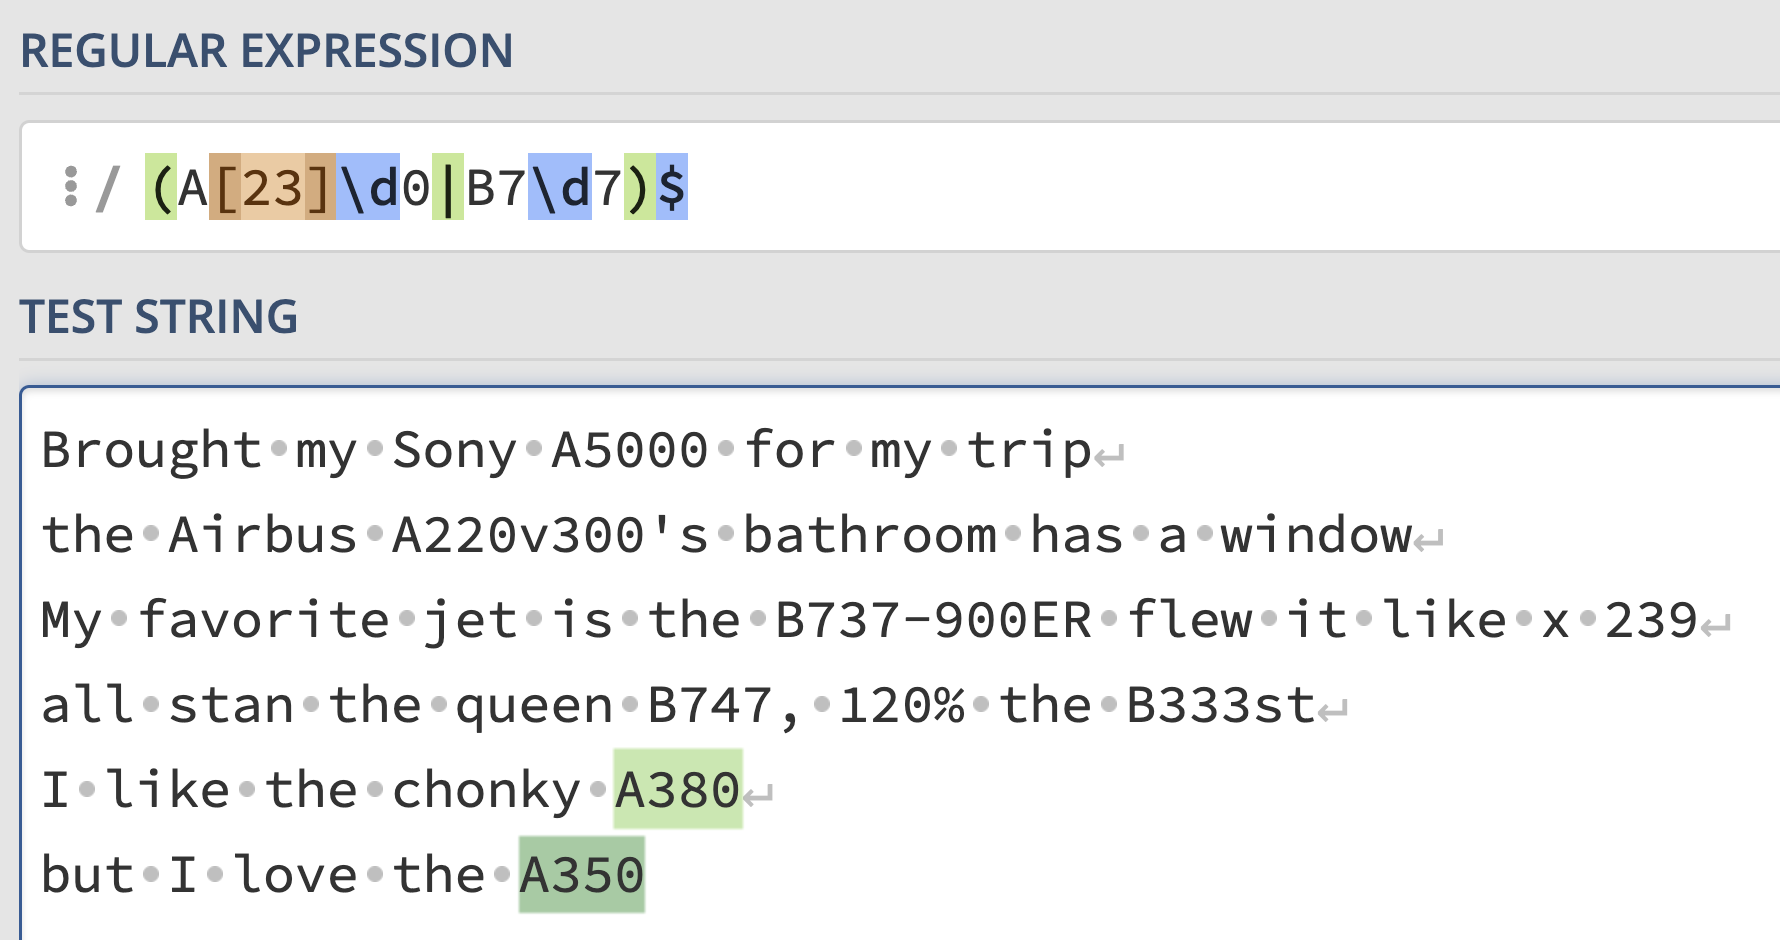
However, the default behavior of
re.findall in Python is that it treats $ as an
end-of-string anchor, rather than an end-of-line
character. So, in Python, only the final plane code of
"A350" is extracted by default.
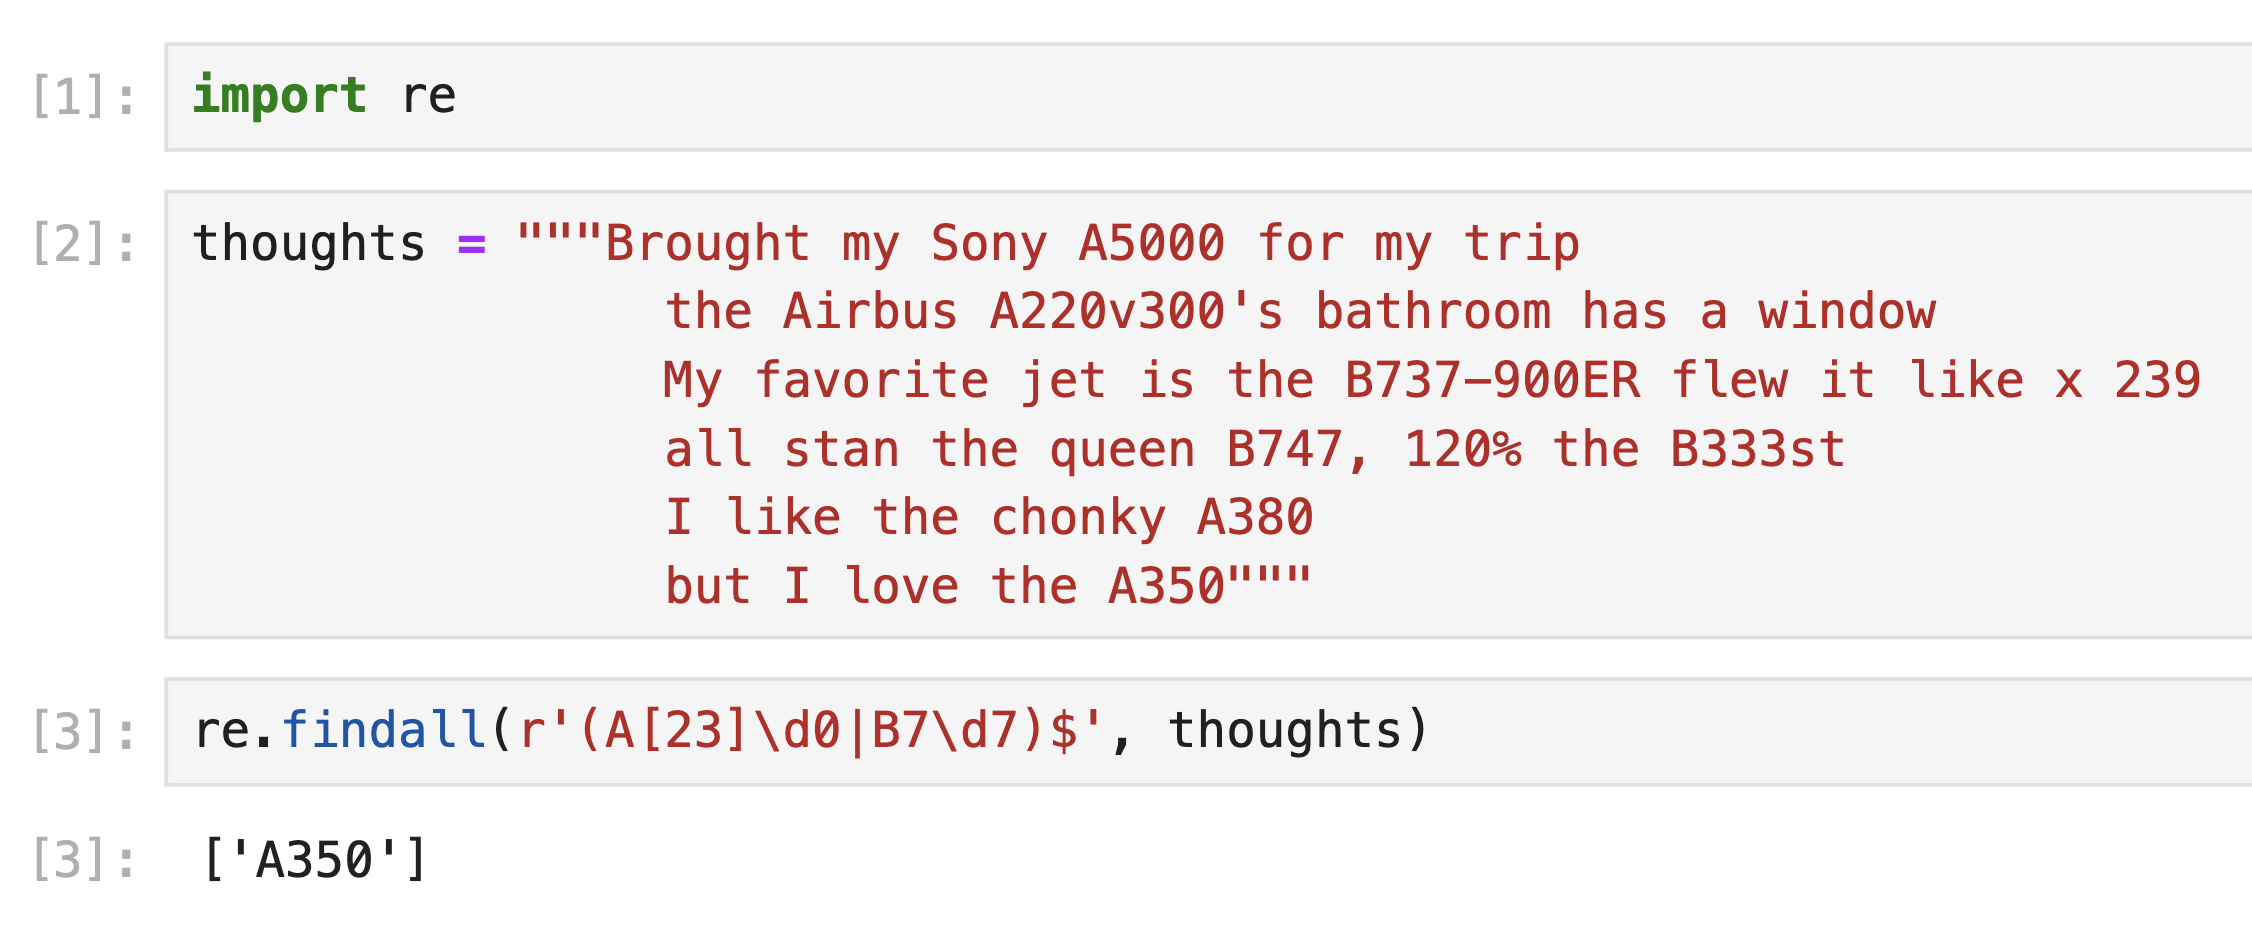
So, we gave full credit to both 1 and 2 as answers.
Interact with the solution on regex101 at this link.
The average score on this problem was 80%.
The following bag of words matrix represents the frequencies of various words across four reviews. Assume, just for this question, that the only five words that appear in any review are the columns of this matrix, and all calculations use a base-2 logarithm.

The matrix has three unknown integer values, A, B, and C. However, we’re given that:
"movies" in Review 0 is \frac{5}{4}."landing" in Review 2 is \frac{1}{5}.What is the value of A? Show your work, and \boxed{\text{box}} your final answer.
Answer: 10.
The information we need to answer this part comes from the first bullet point:
The TF-IDF of
"movies"in Review 0 is \frac{5}{4}.
Recall, the TF-IDF of "movies" in Review 0 is:
\begin{align*} \text{tfidf}(\text{``movies"}, \text{Review 0}) &= \text{tf}(\text{``movies"}, \text{Review 0}) \cdot \text{idf}(\text{``movies"}) \\ &= \frac{ \text{number of occurrences of ``movies" in Review 0}}{\text{total number of terms in Review 0}} \cdot \log_2 \left( \frac{\text{total number of reviews}}{\text{number of reviews in which ``movies" appears}} \right) \end{align*}
Here, we have:
"movies" in Review 0 is
A."movies" occurs is 1 – it
only occurs in Review 0."movies" in Review 0 is, as the question
tells us, \frac{5}{4}.Putting all of this together, we have:
\begin{align*}\frac{5}{4} &= \frac{A}{6+A} \cdot \underbrace{\log_2\left(\frac{4}{1}\right)}_{\text{this is } 2\text{, because }2^2 = 4} \\ \frac{5}{4} &= \frac{A}{6+A} \cdot 2 \\ \frac{5}{8} &= \frac{A}{6+A} \\ 5(6+A) &= 8A \\ 30 + 5A &= 8A \\ 30 &= 3A \\ A &= \boxed{10} \end{align*}
The average score on this problem was 83%.
What is the value of B? Show your work, and \boxed{\text{box}} your final answer.
Answer: 3.
The information we need to answer this part comes from the last bullet point:
The cosine similarity between the bag of words vectors for Reviews 1 and 2 is \frac{16}{21}.
Recall, the cosine similarity between two vectors \vec u and \vec v is:
\text{cosine similarity}(\vec u, \vec v) = \frac{\vec u \cdot \vec v}{\lVert \vec u \rVert \lVert \vec v \rVert}
Here, let \vec{r_1} be the row vector for Review 1 and let \vec r_2 be the row vector for Review 2.
\vec r_1 \cdot \vec r_2 = \begin{bmatrix} 0 \\ 6 \\ B \\ 2 \\ 0 \end{bmatrix} \cdot \begin{bmatrix} 4 \\ 8 \\ 0 \\ 8 \\ 0 \end{bmatrix} = 6 \cdot 8 + 2 \cdot 8 = 48 + 16 = 64.
\lVert \vec r_1 \rVert = \sqrt{0^2 + 6^2 + B^2 + 2^2 + 0^2} = \sqrt{B^2 + 40}.
\lVert \vec r_2 \rVert = \sqrt{4^2 + 8^2 + 0^2 + 8^2 + 0^2} = \sqrt{16 + 64 + 64} = \sqrt{144} = 12.
So, we have:
\begin{align*} \text{cosine similarity}(\vec r_1, \vec r_2) &= \frac{\vec r_1 \cdot \vec r_2}{\lVert \vec r_1 \rVert \lVert \vec r_2 \rVert} \\ \frac{16}{21} &= \frac{64}{12\sqrt{B^2 + 40}} \\ \frac{64}{84} &= \frac{64}{12\sqrt{B^2 + 40}} \\ 84 &= 12 \sqrt{B^2 + 40} \\ 7 &= \sqrt{B^2 + 40} \\ 49 &= B^2 + 40 \\ 9 &= B^2 \\ B = \boxed{3} \end{align*}
The average score on this problem was 67%.
What is the value of C? Show your work, and \boxed{\text{box}} your final answer.
Answer: 0.
The information we need to answer this part comes from the second bullet point:
The TF-IDF of
"landing"in Review 2 is \frac{1}{5}.
As in part 1, we’ll look at the formula for the TF-IDF:
\text{tfidf}(\text{``landing"}, \text{Review 0}) = \frac{ \text{number of occurrences of ``landing" in Review 2}}{\text{total number of terms in Review 2}} \cdot \log_2 \left( \frac{\text{total number of reviews}}{\text{number of reviews in which ``landing" appears}} \right)
Here:
"landing" in Review 2 is
4."landing" appears is
either 2, if C = 0, or 3, if C > 0.Putting together what we know, we have:
\frac{1}{5} = \frac{5}{20} \cdot \log_2 \left( \frac{4}{\text{number of reviews in which ``landing" appears}} \right)
Note that \frac{5}{20} = \frac{1}{4}, so:
\frac{1}{5} = \frac{1}{5} \cdot \log_2 \left( \frac{4}{\text{number of reviews in which ``landing" appears}} \right)
In order for the above to be true, we must have that:
\log_2 \left( \frac{4}{\text{number of reviews in which ``landing" appears}} \right) = 1 \implies \left( \frac{4}{\text{number of reviews in which ``landing" appears}} \right) = 2
This gives us that:
\text{number of reviews in which ``landing" appears} = 2
So, it must be the case that C =
\boxed{0}, because there are already two reviews in which
"landing" appears (Reviews 0 and 2), and if C > 0, then "landing" would
be in three reviews, violating this constraint.
The average score on this problem was 67%.