← return to study.practicaldsc.org
The problems in this worksheet are taken from past exams in similar
classes. Work on them on paper, since the exams you
take in this course will also be on paper.
We encourage you to
attempt these problems before Sunday’s exam review
session, so that we have enough time to walk through the solutions to
all of the problems.
We will enable the solutions here after the
review session, though you can find the written solutions to these
problems in other discussion worksheets.
The EECS 398 staff are looking into hotels — some in San Diego, for their family to stay at for graduation (and to eat Mexican food), and some elsewhere, for summer trips.
Each row of hotels contains information about a
different hotel in San Diego. Specifically, for each hotel, we have:
"Hotel Name" (str): The name of the hotel.
Assume hotel names are unique."Location" (str): The hotel’s neighborhood in San
Diego."Chain" (str): The chain the hotel is a part of; either
"Hilton", "Marriott", "Hyatt", or "Other". A hotel chain is
a group of hotels owned or operated by a shared company."Number of Rooms" (int): The number of rooms the hotel
has.The first few rows of hotels are shown below, but hotels
has many more rows than are shown.
Now, consider the variable summed, defined below.
summed = hotels.groupby("Chain")["Number of Rooms"].sum().idxmax()What is type(summed)?
int
str
Series
DataFrame
DataFrameGroupBy
Answer: str
When we do a groupby on the Chain column in
hotels, this means that the values in the
Chain column will be the indices of the DataFrame or Series
we get as output, in this case the Series
hotels.groupby("Chain")["Number of Rooms"].sum().
Since the values of Chain are strings, and since
.idxmax() will return a value from the index of the
aforementioned Series, summed is a string.
In one sentence, explain what the value of summed means.
Phrase your explanation as if you had to give it to someone who is not a
data science major; that is, don’t say something like “it is the result
of grouping hotels by "Chain", selecting the
"Number of Rooms" column, …”, but instead, give the value
context.
Answer: summed is the name of the hotel
chain with the most total rooms
The result of the .groupby() and .sum() is
a Series indexed by the unique Chains, whose values are the
total number of rooms in hotels owned by each chain. The
idxmax() function gets the index corresponding to the
largest value in the Series, which will be the hotel chain name with the
most total rooms.
Consider the variable curious, defined below.
curious = frame["Chain"].value_counts().idxmax()Fill in the blank: curious is guaranteed to be equal to
summed only if frame has one row for every
____ in San Diego.
hotel
hotel chain
hotel room
neighborhood
Answer: hotel room
curious gets the most common value of Chain
in the DataFrame frame. We already know that
summed is the hotel chain with the most rooms in San Diego,
so curious only equals summed if the most
common Chain in frame is the hotel chain with
the most total rooms; this occurs when each row of frame is
a single hotel room.
Fill in the blanks so that popular_areas is an array of
the names of the unique neighborhoods that have at least 5 hotels and at
least 1000 hotel rooms.
    f = lambda df: __(i)__
    popular_areas = (hotels
                    .groupby(__(ii)__)
                    .__(iii)__
                    __(iv)__)
What goes in blank (i)?
What goes in blank (ii)?
"Hotel Name"
"Location"
"Chain"
"Number of Rooms"
agg(f)
filter(f)
transform(f)
Answers:
df.shape[0] >= 5 and df["Number of Rooms"].sum() >= 1000"Location"filter(f)["Location"].unique() or equivalentWe’d like to only consider certain neighborhoods according to group
characteristics (having >= 5 hotels and >= 1000 hotel rooms), and
.filter() allows us to do that by excluding groups not
meeting those criteria. So, we can write a function that evaluates those
criteria on one group at a time (the df of input to
f is the subset of hotels containing just one
Location value), and calling filter(f) means
that the only remaining rows are hotels in neighborhoods that match
those criteria. Finally, all we have to do is get the unique
neighborhoods from this DataFrame, which are the neighborhoods for which
f returned True.
Consider the code below.
    cond1 = hotels["Chain"] == "Marriott"
    cond2 = hotels["Location"] == "Coronado"
combined = hotels[cond1].merge(hotels[cond2], on="Hotel Name", how=???)??? with "inner" in the code
above, which of the following will be equal to
combined.shape[0]? min(cond1.sum(), cond2.sum())
(cond1 & cond2).sum()
cond1.sum() + cond2.sum()
cond1.sum() + cond2.sum() - (cond1 & cond2).sum()
cond1.sum() + (cond1 & cond2).sum()
??? with "outer" in the code
above, which of the following will be equal to
combined.shape[0]? min(cond1.sum(), cond2.sum())
(cond1 & cond2).sum()
cond1.sum() + cond2.sum()
cond1.sum() + cond2.sum() - (cond1 & cond2).sum()
cond1.sum() + (cond1 & cond2).sum()
Answers:
(cond1 & cond2).sum()cond1.sum() + cond2.sum() - (cond1 & cond2).sum()Note that cond1 and cond2 are boolean
Series, and hotels[cond1] and hotels[cond2]
are the subsets of hotels where
Chain == "Marriott and
"Location" == "Coronado", respectively.
When we perform an inner merge, we’re selecting every row where a
Hotel Name appears in both
hotels[cond1] and hotels[cond2]. This is the
same set of indices (and therefore hotel names, since those are unique)
as where (cond1 & cond2) == True. So, the length of
combined will be the same as the number of
Trues in (cond1 & cond2).
When we perform an outer merge, we’re selecting every row that
appears in either DataFrame, although there will not be repeats
for hotels that are both Marriott properties and are in Coronado. So, to
find the total number of rows in either DataFrame, we take the sum of
the sizes of each, and subtract rows that appear in both, which
corresponds to answer
cond1.sum() + cond2.sum() - (cond1 & cond2).sum().
Billina Records, a new record company focused on creating new TikTok audios, has its offices on the 23rd floor of a skyscraper with 75 floors (numbered 1 through 75). The owners of the building promised that 10 different random floors will be selected to be renovated.
Below, fill in the blanks to complete a simulation that will estimate the probability that Billina Records’ floor will be renovated.
total = 0
repetitions = 10000
for i in np.arange(repetitions):
    choices = np.random.choice(__(a)__, 10, __(b)__)
    if __(c)__:
        total = total + 1
prob_renovate = total / repetitions
What goes in blank (a)?
np.arange(1, 75)
np.arange(10, 75)
np.arange(0, 76)
np.arange(1, 76)
What goes in blank (b)?
replace=True
replace=False
What goes in blank (c)?
choices == 23
choices is 23
np.count_nonzero(choices == 23) > 0
np.count_nonzero(choices) == 23
choices.str.contains(23)
Answer: np.arange(1, 76),
replace=False,
np.count_nonzero(choices == 23) > 0
Here, the idea is to randomly choose 10 different floors repeatedly, and each time, check if floor 23 was selected.
Blank (a): The first argument to np.random.choice needs
to be an array/list containing the options we want to choose from,
i.e. an array/list containing the values 1, 2, 3, 4, …, 75, since those
are the numbers of the floors. np.arange(a, b) returns an
array of integers spaced out by 1 starting from a and
ending at b-1. As such, the correct call to
np.arange is np.arange(1, 76).
Blank (b): Since we want to select 10 different floors, we need to
specify replace=False (the default behavior is
replace=True).
Blank (c): The if condition needs to check if 23 was one
of the 10 numbers that were selected, i.e. if 23 is in
choices. It needs to evaluate to a single Boolean value,
i.e. True (if 23 was selected) or False (if 23
was not selected). Let’s go through each incorrect option to see why
it’s wrong:
choices == 23, does not evaluate to a single
Boolean value; rather, it evaluates to an array of length 10, containing
multiple Trues and Falses.choices is 23, does not evaluate to what we
want – it checks to see if the array choices is the same
Python object as the number 23, which it is not (and will never be,
since an array cannot be a single number).np.count_nonzero(choices) == 23, does
evaluate to a single Boolean, however it is not quite correct.
np.count_nonzero(choices) will always evaluate to 10, since
choices is made up of 10 integers randomly selected from 1,
2, 3, 4, …, 75, none of which are 0. As such,
np.count_nonzero(choices) == 23 is the same as
10 == 23, which is always False, regardless of whether or
not 23 is in choices.choices.str.contains(23), errors, since
choices is not a Series (and .str can only
follow a Series). If choices were a Series, this would
still error, since the argument to .str.contains must be a
string, not an int.By process of elimination, Option 3,
np.count_nonzero(choices == 23) > 0, must be the correct
answer. Let’s look at it piece-by-piece:
choices == 23 is a Boolean array
that contains True each time the selected floor was floor
23 and False otherwise. (Since we’re sampling without
replacement, floor 23 can only be selected at most once, and so
choices == 23 can only contain the value True
at most once.)np.count_nonzero(choices == 23) evaluates to the number
of Trues in choices == 23. If it is positive
(i.e. 1), it means that floor 23 was selected. If it is 0, it means
floor 23 was not selected.np.count_nonzero(choices == 23) > 0 evaluates
to True if (and only if) floor 23 was selected.Suppose the DataFrame today consists of 15 rows — 3 rows
for each of 5 different "artist_names". For each artist, it
contains the "track_name" for their three most-streamed
songs today. For instance, there may be one row for
"olivia rodrigo" and "favorite crime", one row
for "olivia rodrigo" and "drivers license",
and one row for "olivia rodrigo" and
"deja vu".
Another DataFrame, genres, is shown below in its
entirety.
Suppose we perform an inner merge between
today and genres on
"artist_names". If the five "artist_names" in
today are the same as the five "artist_names"
in genres, what fraction of the rows in the merged
DataFrame will contain "Pop" in the "genre"
column? Give your answer as a simplified fraction.
Answer: \frac{2}{5}
If the five "artist_names" in today and
genres are the same, the DataFrame that results from an
inner merge will have 15 rows, one for each row in today.
This is because there are 3 matches for "harry styles", 3
matches for "olivia rodrigo", 3 matches for
"glass animals", and so on.
In the merged DataFrame’s 15 rows, 6 of them will correspond to
"Pop" artists — 3 to "harry styles" and 3 to
"olivia rodrigo". Thus, the fraction of rows that contain
"Pop" in the "genre" column is \frac{6}{15} = \frac{2}{5} (which is the
fraction of rows that contained "Pop" in
genres["genre"], too).
Suppose we perform an inner merge between
today and genres on
"artist_names". Furthermore, suppose that the only
overlapping "artist_names" between today and
genres are "drake" and
"olivia rodrigo". What fraction of the rows in the merged
DataFrame will contain "Pop" in the "genre"
column? Give your answer as a simplified fraction.
Answer: \frac{1}{2}
If we perform an inner merge, there will only be 6 rows in the merged
DataFrame — 3 for "olivia rodrigo" and 3 for
"drake". 3 of those 6 rows will have "Pop" in
the "genre" column, hence the answer is \frac{3}{6} = \frac{1}{2}.
Suppose we perform an outer merge between
today and genres on
"artist_names". Furthermore, suppose that the only
overlapping "artist_names" between today and
genres are "drake" and
"olivia rodrigo". What fraction of the rows in the merged
DataFrame will contain "Pop" in the "genre"
column? Give your answer as a simplified fraction.
Answer: \frac{2}{9}
Since we are performing an outer merge, we can decompose the rows in the merged DataFrame into three groups:
Rows that are in today that are not in
genres. There are 9 of these (3 each for the 3 artists that
are in today and not genres).
today doesn’t have a "genre" column, and so
all of these "genre"s will be NaN upon
merging.
Rows that are in genres that are not in
today. There are 3 of these — one for
"harry styles", one for "glass animals", and
one for "doja cat". 1 of these 3 have "Pop" in
the "genre" column.
Rows that are in both today and genres.
There are 6 of these — 3 for "olivia rodrigo" and 3 for
"drake" — and 3 of those rows contain "Pop" in
the "genre" column.
Tallying things up, we see that there are 9
+ 3 + 6 = 18 rows in the merged DataFrame overall, of which 0 + 1 + 3 = 4 have "Pop" in the
"genre" column. Hence, the relevant fraction is \frac{4}{18} = \frac{2}{9}.
The DataFrame random_10 contains the
"track_name" and "genre" of 10 randomly-chosen
songs in Spotify’s Top 200 today, along with their
"genre_rank", which is their rank in the Top 200
among songs in their "genre". For
instance, “the real slim shady" is the 20th-ranked Hip-Hop/Rap song in
the Top 200 today. random_10 is shown below in its
entirety.
The "genre_rank" column of random_10
contains missing values. Below, we provide four different imputed
"genre_rank" columns, each of which was created using a
different imputation technique. On the next page, match each of the four
options to the imputation technique that was used in the option.
Note that each option (A, B, C, D) should be used exactly once between parts (a) and (d).
In which option was unconditional mean imputation used?
Answer: Option B
Explanation given in part d) below
In which option was mean imputation conditional on
"genre" used?
Answer: Option D
Explanation given in part d) below
In which option was unconditional probabilistic imputation used?
Answer: Option C
Explanation given in part d) below
In which option was probabilistic imputation conditional on
"genre" used?
Answer: Option A
First, note that in Option B, all three missing values are filled
in with the same number, 7. The mean of the observed values in
random_10["genre rank"] is 7, so we must have performed
unconditional mean imputation in Option B. (Technically, it’s possible
for Option B to be the result of unconditional probabilistic imputation,
but we stated that each option could only be used once, and there is
another option that can only be unconditional probabilistic
imputation.)
Then note that in Option C, the very last missing value (in the
"Pop" "genre") is filled in with a 7, which is
not the mean of the observed "Pop" values, but rather a
value from the "Alternative" "genre". This
must mean that unconditional probabilistic imputation was used in Option
C, since that’s the only way a value from a different group can be used
for imputation (if we are not performing some sort of mean
imputation).
This leaves Option A and Option D. The last two missing values
(the two in the "Pop" "genre") are both filled
in with the same value, 2 in Option A and 5 in Option D. The mean of the
observed values for the "Pop" "genre" is \frac{9+2+4}{3} = 5, so mean imputation
conditional on "genre" must have been used in Option D and
thus probabilistic imputation conditional on "genre" must
have been used in Option A.
You want to use regular expressions to extract out the number of ounces from the 5 product names below.
| Index | Product Name | Expected Output |
|---|---|---|
| 0 | Adult Dog Food 18-Count, 3.5 oz Pouches | 3.5 |
| 1 | Gardetto’s Snack Mix, 1.75 Ounce | 1.75 |
| 2 | Colgate Whitening Toothpaste, 3 oz Tube | 3 |
| 3 | Adult Dog Food, 13.2 oz. Cans 24 Pack | 13.2 |
| 4 | Keratin Hair Spray 2!6 oz | 6 |
The names are stored in a pandas Series called names.
For each snippet below, select the indexes for all the product names
that will not be matched correctly.
For the snippet below, which indexes correspond to products that will not be matched correctly?
regex = r'([\d.]+) oz'
names.str.findall(regex)
0
1
2
3
4
All names will be matched correctly.
Answer: Only product 1 will not be matched; the pattern only looks for “oz” so the “Ounce” is not identified. See this Regex101 link for an illustration.
For the snippet below, which indexes correspond to products that will not be matched correctly?
regex = r'(\d+?.\d+) oz|Ounce'
names.str.findall(regex)
0
1
2
3
4
All names will be matched correctly.
Answer: 1, 2, and 4 are either not matched or done so incorrectly. This pattern matches either numbers+any character+numbers+[a space]+“oz” OR “Ounce”. However it fails in the following ways:
See this Regex101 link for an interactive illustration.
Rahul is trying to scrape the website of an online bookstore ‘The Book Club’.
<HTML>
<H1>The Book Club</H1>
<BODY BGCOLOR="FFFFFF">
Email us at <a href="mailto:support@thebookclub.com">
support@thebookclub.com</a>.

<div>
    <ol class="row">
    <li class="book_list">

        <article class="product_pod">
            <div class="image_container">
                    <img src="pic1.jpeg" alt="A Light in the Attic"
                    class="thumbnail">
            </div>

            <p class="star-rating Three"></p>

            <h3>
            <a href="cat/index.html" title="A Light in the Attic">
            A Light in the Attic
            </a>
            </h3>

            <div class="product_price">
                <p class="price_color">£51.77</p>

                <p class="instock availability">
                    <i class="icon-ok"></i>
                    In stock
                </p>

            </div>
        </article>
    </li>
    </ol>

</div>
</BODY>
</HTML>
Which is the equivalent Document Object Model (DOM) tree of this HTML file?
Tree A
Tree B
Tree C
Tree D
Answer: Tree D
Following tree D in the image from top to bottom, we can follow the nesting of tags in the HTML file to verify that the DOM tree D matches the syntax of the HTML file.
Rahul wants to extract the ‘instock availability’ status
of the book titled ‘A Light in the Attic’. Which of the following
expressions will evaluate to "In Stock"? Assume that Rahul
has already parsed the HTML into a BeautifulSoup object stored in the
variable named soup.
Code Snippet A
    soup.find('p',attrs = {'class': 'instock availability'})\
    .get('icon-ok').strip()
Code Snippet B
soup.find('p',attrs = {'class': 'instock availability'}).text.strip()Code Snippet C
    soup.find('p',attrs = {'class': 'instock availability'}).find('i')\
    .text.strip()
Code Snippet D
    soup.find('div', attrs = {'class':'product_price'})\
    .find('p',attrs = {'class': 'instock availability'})\
.find('i').text.strip()Answer: Code Snippet B
Code Snippet B is the only option that finds the tag p
with the attribute class being equal to
instock availability and then getting the text contained in
that tag, which is equal to ‘instock availability’.
Option A will cause an error because of .get('icon-ok')
since 'icon-ok' is not the name of the attribute, but is
instead the value of the class attribute.
Option C and D will both get the text of the i tag,
which is '' and is therefore incorrect.
Rahul also wants to extract the number of stars that the book titled
‘A Light in the Attic’ received. If you look at the HTML file, you will
notice that the book received a star rating of three. Which code snippet
will evaluate to "Three"?
Code Snippet A
soup.find('article').get('class').strip()Code Snippet B
soup.find('p').text.split(' ')Code Snippet C
soup.find('p').get('class')[1]None of the above
Answer: Code Snippet C
Code Snippet C finds the first occurence of the tag p,
gets the contents of its class attribute as a list, and
returns the last element, which is the rating 'Three' as
desired.
Option A will error because .get('class') returns
['product_pod'] and strip cannot be used on a list, but
also the content of the list does not bring us closer to the desired
result.
Option B gets the text contained within the first p tag
as a list, which is [''].
Tahseen decides to look at reviews for the same hotel, but he
modifies them so that the only terms they contain are
"taco" and "sand". The bag-of-words
representations of three reviews are shown as vectors below.
Using cosine similarity to measure similarity, which pair of reviews are the most similar? If there are multiple pairs of reviews that are most similar, select them all.
\vec{r}_1 and \vec{r}_2
\vec{r}_1 and \vec{r}_3
\vec{r}_2 and \vec{r}_3
Answer: \vec{r}_1 and \vec{r}_2, and \vec{r}_2 and \vec{r}_3
The cosine similarity of two vectors \vec{a} and \vec{b} is \frac{\vec{a} \cdot \vec{b}}{||\vec{a}|| \cdot ||\vec{b}||}.
\frac{12}{13} \approx 0.9231 and \frac{5}{\sqrt{26}} \approx 0.9806. Since larger cosine similarities mean more similar vectors, our answer is vector pairs \vec{r}_1, \vec{r}_2 AND \vec{r}_2, \vec{r}_3.
Note that we could’ve answered the question without finding the cosine similarity between \vec{r}_1 and \vec{r}_3. Remember, the cosine similarity between two vectors is the cosine of the angle between the two vectors.
You create a table called gums that only contains the
chewing gum purchases of df, then you create a bag-of-words
matrix called bow from the name column of
gums. The bow matrix is stored as a DataFrame
shown below:
You also have the following outputs:
>>> bow_df.sum(axis=0)     >>> bow_df.sum(axis=1)     >>> bow_df.loc[0, 'pur']
pur            5           0     21                   0
gum           41           1     22
sugar          2           2     22                   >>> (bow_df['paperboard'] > 0).sum()
              ..                 ..                   20
90             4           37    22
paperboard    22           38    10                   >>> bow_df['gum'].sum()
80            20           39    17                   41
Length: 139                Length: 40
For each question below, write your answer as an unsimplified math expression (no need to simplify fractions or logarithms) in the space provided, or write “Need more information” if there is not enough information provided to answer the question.
What is the TF-IDF for the word “pur” in document 0?
Answer: 0
First, it’s worth discussing what information we have.
bow_df.sum(axis=0) computes the sum of each
column of bow_df. Each column of
bow_df refers to a specific word, so the sum of a column in
bow_df tells us the number of occurrences of a particular
word across the entire corpus (all documents).bow_df.sum(axis=1) computes the sum of each
row of bow_df. Each row of
bow_df refers to a specific document, so the sum of a row
in bow_df tells us the number of words in a
particular document.bow_df.loc[0, 'pur'] being 0 tells us that
the word "pur" appears 0 times in document 0.(bow_df["paperboard"] > 0).sum() being
20 means that there are 20 documents that contain the word
"paperboard".bow_df["gum"].sum() being 41 means that
"gum" appears 41 times across all documents.Now, back to the subpart at hand. The TF-IDF of “pur” in document 0 is 0, because bullet point 3 above tells us that “pur” doesn’t occur at all in document 0. This means that the term frequency of “pur” in document 0 is 0, which means the TF-IDF (which is the product of the term frequency and inverse document frequency) of “pur” in document 0 is also 0, because 0 multiplied by the IDF of “pur” must be 0.
What is the TF-IDF for the word “gum” in document 0?
Answer: Need more information
Let’s try and compute the TF-IDF of “gum” in document 0. The formula is as follows:
\text{tfidf}(\text{gum}, \text{document 0}) = \text{tf}(\text{gum}, \text{document 0}) \cdot \text{idf}(\text{gum})
= \frac{\# \text{ of words in document 0 equal to gum}}{\# \text{ of words in document 0}} \cdot \log \left( \frac{\text{ total \# of documents}}{\text{total \# of documents containing gum}} \right)
= \frac{1}{21} \cdot \log \left( \frac{40}{???} \right)
We don’t know the number of documents containing “gum” – all we know (from bullet point 5 in the previous solution) is that “gum” appears 41 times across all documents, but we don’t know how many unique documents contain “gum”. So, we need more information.
What is the TF-IDF for the word “paperboard” in document 1?
Answer: \frac{1}{22}
Let’s try and compute the TF-IDF of “paperboard” in document 1. The formula is as follows (assuming a base-2 logarithm):
\text{tfidf}(\text{"paperboard"}, \text{document 1}) = \text{tf}(\text{"paperboard"}, \text{document 1}) \cdot \text{idf}(\text{"paperboard"})
= \frac{\text{\# of words in document 1 equal to "paperboard"}}{\text{\# of words in document 1}} \cdot \log \left( \frac{\text{total \# of documents}}{\text{total \# of documents containing "paperboard"}} \right)
= \frac{\text{1}}{\text{22}} \cdot \log \left( \frac{\text{40}}{\text{20}} \right) = \frac{\text{1}}{\text{22}} \cdot \log(\text{2}) = \frac{\text{1}}{\text{22}} \cdot \text{1} = \frac{\text{1}}{\text{22}}
Consider a dataset of n integers, y_1, y_2, ..., y_n, whose histogram is given below:
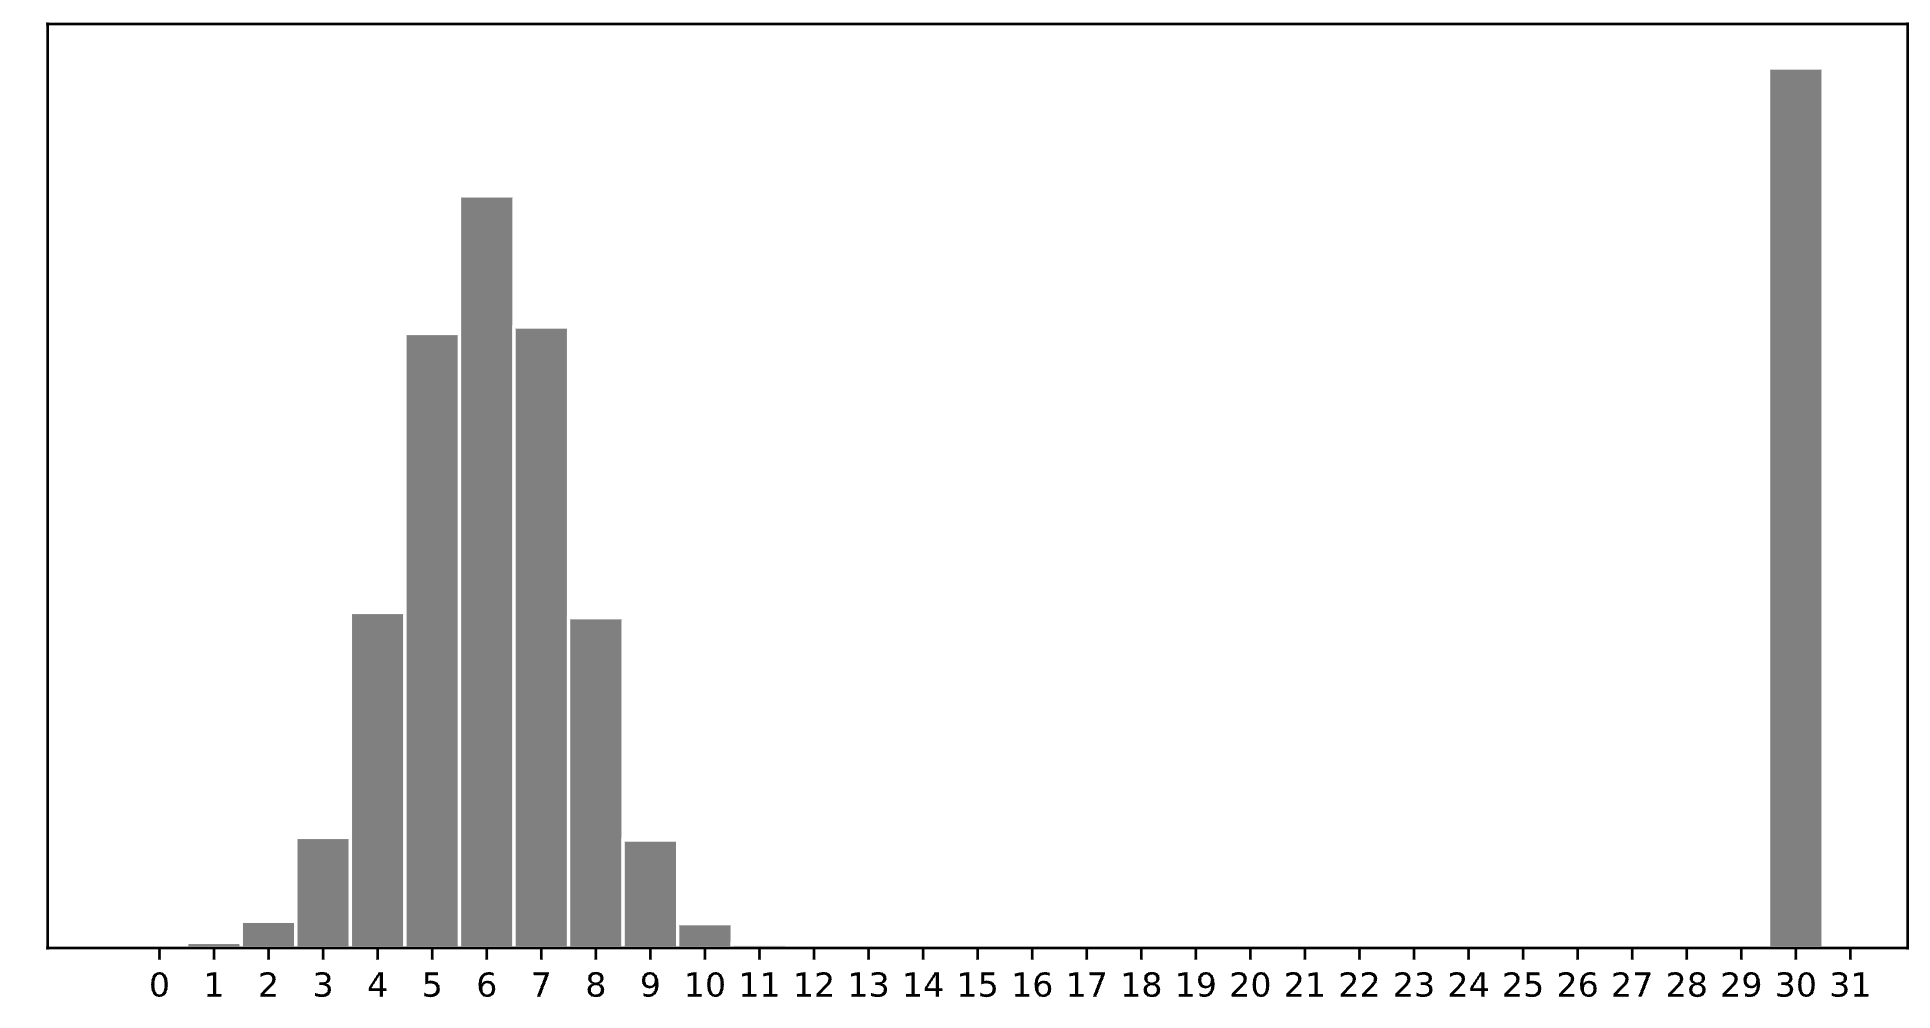
Which of the following is closest to the constant prediction h^* that minimizes:
\displaystyle \frac{1}{n} \sum_{i = 1}^n \begin{cases} 0 & y_i = h \\ 1 & y_i \neq h \end{cases}
1
5
6
7
11
15
30
30.
The minimizer of empirical risk for the constant model when using zero-one loss is the mode.
Which of the following is closest to the constant prediction h^* that minimizes: \displaystyle \frac{1}{n} \sum_{i = 1}^n |y_i - h|
1
5
6
7
11
15
30
7.
The minimizer of empirical risk for the constant model when using absolute loss is the median. If the bar at 30 wasn’t there, the median would be 6, but the existence of that bar drags the “halfway” point up slightly, to 7.
Which of the following is closest to the constant prediction h^* that minimizes: \displaystyle \frac{1}{n} \sum_{i = 1}^n (y_i - h)^2
1
5
6
7
11
15
30
11.
The minimizer of empirical risk for the constant model when using squared loss is the mean. The mean is heavily influenced by the presence of outliers, of which there are many at 30, dragging the mean up to 11. While you can’t calculate the mean here, given the large right tail, this question can be answered by understanding that the mean must be larger than the median, which is 7, and 11 is the next biggest option.
Which of the following is closest to the constant prediction h^* that minimizes: \displaystyle \lim_{p \rightarrow \infty} \frac{1}{n} \sum_{i = 1}^n |y_i - h|^p
1
5
6
7
11
15
30
15.
The minimizer of empirical risk for the constant model when using infinity loss is the midrange, i.e. halfway between the min and max.
Consider a dataset that consists of y_1, \cdots, y_n. In class, we used calculus to minimize mean squared error, R_{sq}(h) = \frac{1}{n} \sum_{i = 1}^n (h - y_i)^2. In this problem, we want you to apply the same approach to a slightly different loss function defined below: L_{\text{midterm}}(y,h)=(\alpha y - h)^2+\lambda h
Write down the empiricial risk R_{\text{midterm}}(h) by using the above loss function.
R_{\text{midterm}}(h)=\frac{1}{n}\sum_{i=1}^{n}[(\alpha y_i - h)^2+\lambda h]=[\frac{1}{n}\sum_{i=1}^{n}(\alpha y_i - h)^2] +\lambda h
The mean of dataset is \bar{y}, i.e. \bar{y} = \frac{1}{n} \sum_{i = 1}^n y_i. Find h^* that minimizes R_{\text{midterm}}(h) using calculus. Your result should be in terms of \bar{y}, \alpha and \lambda.
h^*=\alpha \bar{y} - \frac{\lambda}{2}
\begin{align*} \frac{d}{dh}R_{\text{midterm}}(h)&= [\frac{2}{n}\sum_{i=1}^{n}(h- \alpha y_i )] +\lambda \\ &=2 h-2\alpha \bar{y} + \lambda. \end{align*}
By setting \frac{d}{dh}R_{\text{midterm}}(h)=0 we get 2 h^*-2\alpha \bar{y} + \lambda=0 \Rightarrow h^*=\alpha \bar{y} - \frac{\lambda}{2}.