Answer:
\vec \mu_1 = \left( -6, -\frac{14}{3} \right) \vec \mu_2 = \left( 4, \frac{4}{3} \right)
\vec \mu_1 is the average of 3 points on the bottom left, and \vec \mu_2 is the average of 3 points on the top right.
← return to study.practicaldsc.org
The problems in this worksheet are taken from past exams in similar classes. Work on them on paper, since the exams you take in this course will also be on paper.
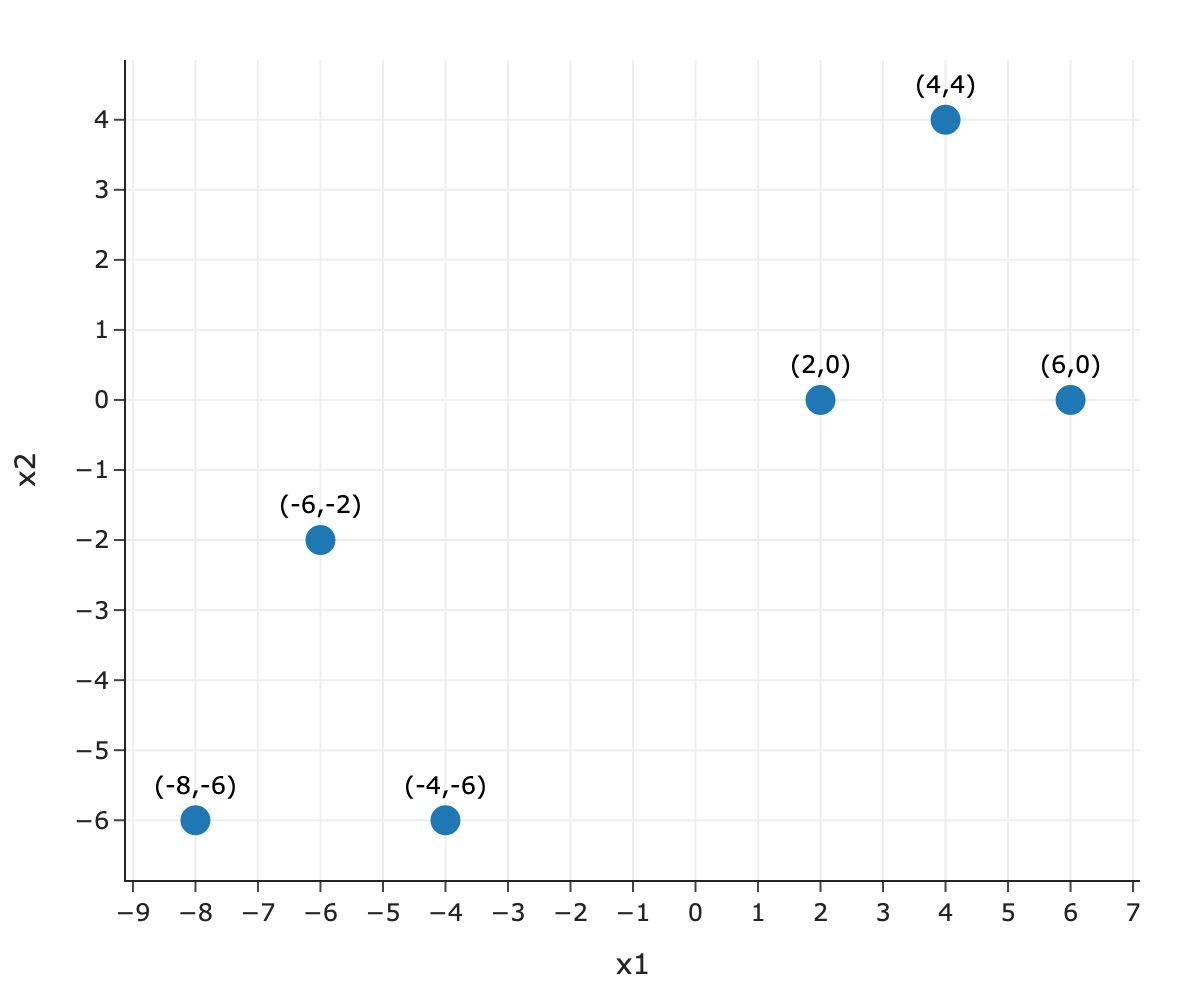
Consider the following dataset of n=6 points in d=2 dimensions.
| x^{(1)} | x^{(2)} |
|---|---|
| -8 | -6 |
| -6 | -2 |
| -4 | -6 |
| 2 | 0 |
| 4 | 4 |
| 6 | 0 |
We’d like to use k-means clustering to cluster the data into k=2 clusters.
Plot out the data. What are the optimal locations for the centroids, \vec \mu_1 and \vec \mu_2? Write down the coordinates.
Answer:
\vec \mu_1 = \left( -6, -\frac{14}{3} \right) \vec \mu_2 = \left( 4, \frac{4}{3} \right)
\vec \mu_1 is the average of 3 points on the bottom left, and \vec \mu_2 is the average of 3 points on the top right.
Remember, if our data is high-dimensional, we won’t be able to visualize it to determine our centroids. Instead, we’ll need to run the k-means clustering algorithm.
Perform three iterations of the k-means algorithm by hand. Assume that we initialize the centroids at \vec \mu_1 = \left( 2, 1 \right) and \vec \mu_2 = \left( 3, 4 \right). In each iteration:
Table 1:
| x^{(1)} | x^{(2)} | Iter 1 | Iter 2 | Iter 3 |
|---|---|---|---|---|
| -8 | -6 | |||
| -6 | -2 | |||
| -4 | -6 | |||
| 2 | 0 | |||
| 4 | 4 | |||
| 6 | 0 |
Table 2:
| \vec \mu_1 | \vec \mu_2 | |
|---|---|---|
| Iter 0 | (2, 1) | (3, 4) |
| Iter 1 | ||
| Iter 2 | ||
| Iter 3 |
Note: You don’t have to calculate the distances explicitly (i.e. you can use your intuition in determining which points belong to which clusters).
Answer:
Table 1:
| x^{(1)} | x^{(2)} | Iter 1 | Iter 2 | Iter 3 |
|---|---|---|---|---|
| -8 | -6 | 1 | 1 | 1 |
| -6 | -2 | 1 | 1 | 1 |
| -4 | -6 | 1 | 1 | 1 |
| 2 | 0 | 1 | 2 | 2 |
| 4 | 4 | 2 | 2 | 2 |
| 6 | 0 | 1 | 2 | 2 |
Table 2:
| \vec \mu_1 | \vec \mu_2 | |
|---|---|---|
| Iter 0 | (2, 1) | (3, 4) |
| Iter 1 | (-2, -14/5) | (4, 4) |
| Iter 2 | (-6,-14/3) | (4, 4/3) |
| Iter 3 | (-6, -14/3) | (4, 4/3) |
Depending on our initial centroids, k-means may “converge” to a clustering that does not actually have the lowest possible inertia. In other words, like gradient descent, k-means can get caught in a local minimum. What are possible solutions to this issue?
Possible answers:
Run k-means several times, each with different randomly chosen initial centroids. Keep track of the inertia of the final result in each attempt. Choose the attempt with the lowest inertia.
Choose one initial centroid at random, and choose the remaining initial centroids by maximizing distance from all other centroids. This is the strategy behind k-means++.
Consider the following plot of data in d=2 dimensions. We’d like to use k-means clustering to cluster the data into k=3 clusters.
Suppose the crosses represent initial centroids, which are not themselves data points.
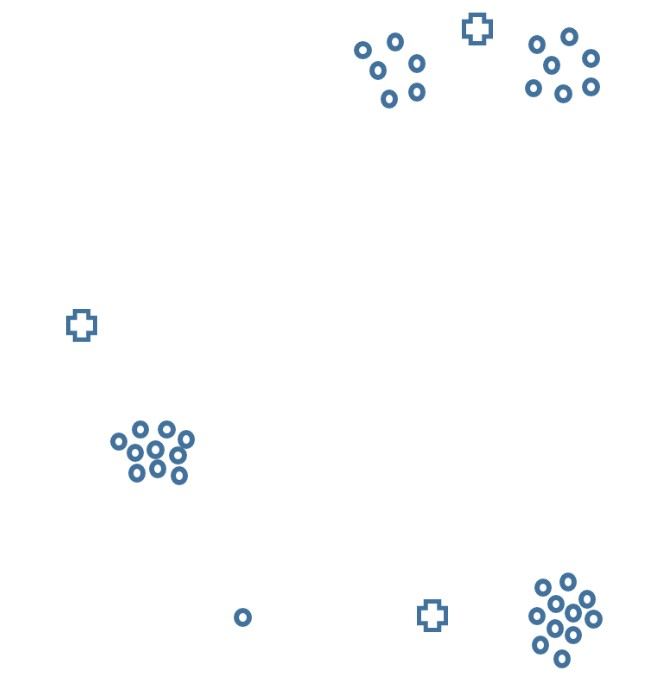
Which of the following facts are true about the cluster assignment during the first iteration, as determined by these initial centroids? Select all that apply.
Exactly one cluster contains 11 data points.
Exactly two clusters contain 11 data points.
Exactly one cluster contains at least 12 data points.
Exactly two clusters contain at least 12 data points.
None of the above.
Answer: Exactly two clusters contain at least 12 data points.
Thus, the top cluster and bottom right clusters will contain at least 12 data points in Step 1 of the first iteration.
The cross shapes in the plot above represent positions of the initial centroids before the first iteration. Now the algorithm is run for one iteration, after which the centroids have been adjusted.
We are now starting the second iteration. Which of the following facts are true about the cluster assignment during the second iteration? Select all that apply.
Exactly one cluster contains 11 data points.
Exactly two clusters contain 11 data points.
Exactly one cluster contains at least 12 data points.
Exactly two clusters contain at least 12 data points.
None of the above.
Answers: Both of:
Let’s look at each cluster once again.
So, the cluster sizes are 13, 11, and 11, which means that two of the clusters contain 11 data points and one of the clusters contains at least 12 data points.
Compare the value of inertia after the end of the second iteration to the value of inertia at the end of the first iteration. Which of the following facts are true? Select all that apply.
The inertia at the end of the second iteration is lower.
The inertia doesn’t decrease since there are actually 4 clusters in the data but we are using k-means with k=3.
The inertia doesn’t decrease since there are actually 5 clusters in the data but we are using k-means with k=3.
The inertia doesn’t decrease since there is an outlier that does not belong to any cluster.
The inertia at the end of the second iteration is the same as at the end of the first iteration.
Answer: The inertia at the end of the second iteration is lower.
The inertia after each iteration of k-means clustering is non-increasing. Specifically, at the end of the second iteration the outlier having moved from the bottom right cluster to the left cluster will have decreased the inertia, as this movement reduced the total sum of the squared distances of points to their closest centroids.
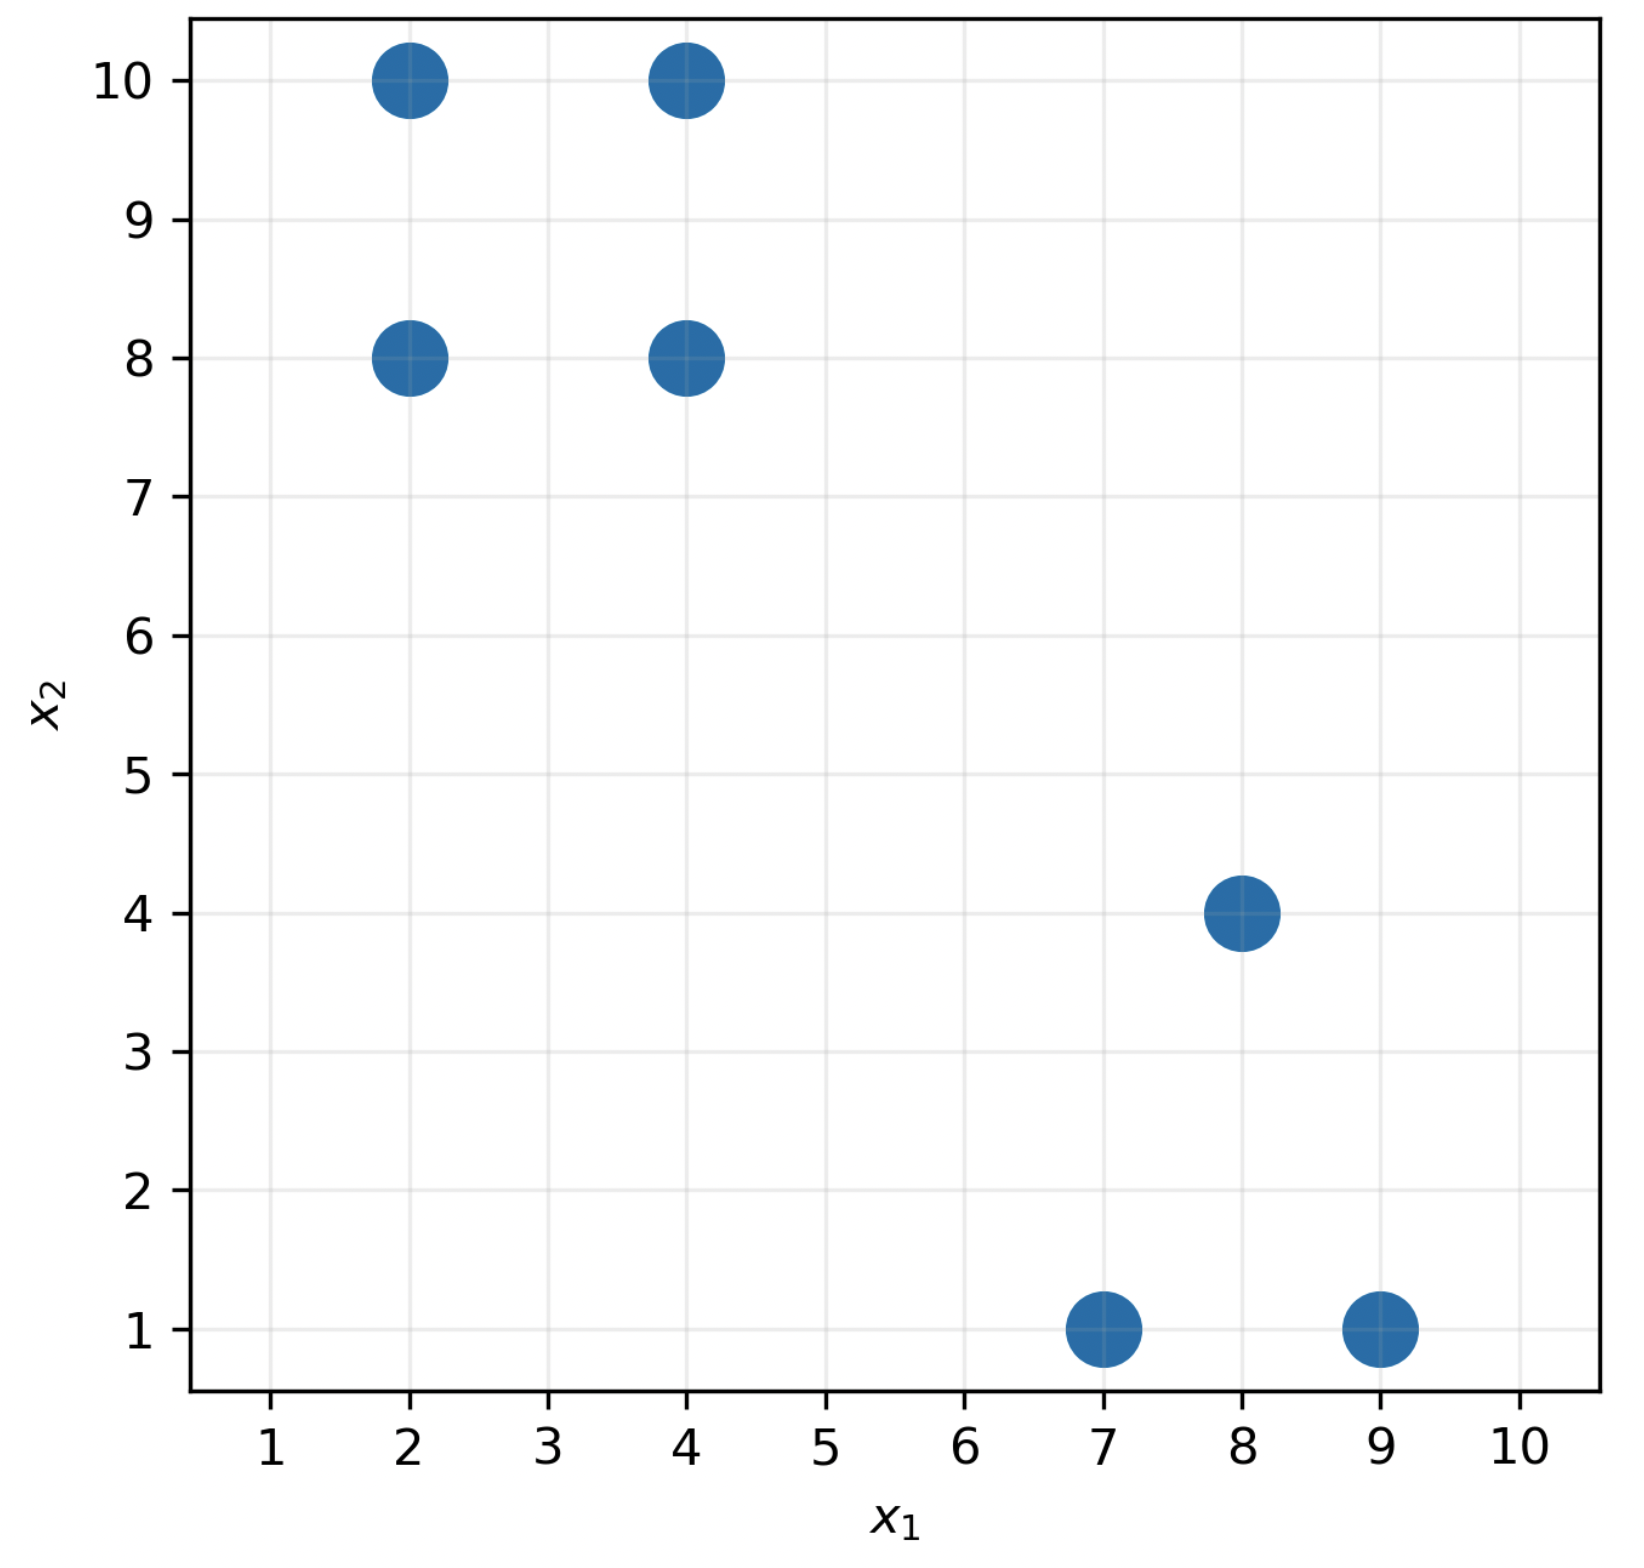
Consider the following dataset of n=7 points in d=2 dimensions.
Suppose we decide to use agglomerative clustering to cluster the data. How many possible pairs of clusters could we combine in the first iteration?
Answer: 5
Recall, in agglomerative clustering, we combine the two closest clusters at each iteration. In the first iteration, each point is in its own cluster. There are 5 pairs of points that are all at a distance of 2 units from each other, and no pair of points is closer than 2 units.
Specifically, any two adjacent vertices in the “square” in the top left are 2 units apart (top left and top right, top right and bottom right, bottom left and bottom right, bottom left and top left), which adds to 4 pairs. Then, the bottom two vertices in the triangle in the bottom left are also 2 units apart. This totals 4 + 1 = 5 pairs of points that are all at a distance of 2 units from each other, so there are 5 possible clusters we could combine in the first iteration.
Suppose we want to identify k=2 clusters in this dataset using k-means clustering.
Determine the centroids \vec{\mu}_1 and \vec{\mu}_2 that minimize inertia. (Let \vec{\mu}_1 be the centroid with a smaller x_1 coordinate.) Justify your answers.
Note: You don’t have to run the k-Means Clustering algorithm to answer this question.
Answer: \vec{\mu}_1 = \begin{bmatrix} 3 \\ 9 \end{bmatrix}, \vec{\mu}_2 = \begin{bmatrix} 8 \\ 2 \end{bmatrix}
It’s clear that there are two clusters — one in the top left, and one in the bottom right.
To find \vec{\mu}_1, the centroid for the top-left cluster, we take the mean of four points assigned to cluster 1, giving
\vec{\mu}_1 = \frac{1}{4} \left( \begin{bmatrix} 2 \\ 8 \end{bmatrix} + \begin{bmatrix} 4 \\ 8 \end{bmatrix} + \begin{bmatrix} 2 \\ 10 \end{bmatrix} + \begin{bmatrix} 4 \\ 10 \end{bmatrix} \right) = \begin{bmatrix} 3 \\ 9 \end{bmatrix}
You can also arrive at this result without any algebra by taking the middle of the ‘square’.
To find \vec{\mu}_2, the centroid for the bottom-right cluster, we take the mean of three points assigned to cluster 2, giving
\vec{\mu}_2 = \frac{1}{3} \left( \begin{bmatrix} 7 \\ 1 \end{bmatrix} + \begin{bmatrix} 8 \\ 4 \end{bmatrix} + \begin{bmatrix} 9 \\ 1 \end{bmatrix} \right) = \begin{bmatrix} 8 \\ 2 \end{bmatrix}
Thus,
\vec{\mu}_1 = \begin{bmatrix} 3 \\ 9 \end{bmatrix}, \vec{\mu}_2 = \begin{bmatrix} 8 \\ 2 \end{bmatrix}
What is the total inertia for the centroids you chose in the previous part? Show your work.
Answer: 16
We’ll proceed by determining the inertia of each cluster individually and adding the results together.
First, let’s consider the top-left cluster, whose centroid is at \begin{bmatrix} 3 \\ 9 \end{bmatrix}. The squared distance between the centroid and each of the four points in the cluster individually is 1^2 + 1^2 = 2. It’s easiest to see this by drawing a picture, but we can calculate all squared distances algebraically as well:
\begin{bmatrix} 2 \\ 8 \end{bmatrix} - \begin{bmatrix} 3 \\ 9 \end{bmatrix} = \begin{bmatrix} -1 \\ -1 \end{bmatrix} \implies \text{squared distance} = (-1)^2 + (-1)^2 = 2
\begin{bmatrix} 4 \\ 8 \end{bmatrix} - \begin{bmatrix} 3 \\ 9 \end{bmatrix} = \begin{bmatrix} 1 \\ -1 \end{bmatrix} \implies \text{squared distance} = (1)^2 + (-1)^2 = 2
\begin{bmatrix} 2 \\ 10 \end{bmatrix} - \begin{bmatrix} 3 \\ 9 \end{bmatrix} = \begin{bmatrix} -1 \\ 1 \end{bmatrix} \implies \text{squared distance} = (-1)^2 + (1)^2 = 2
\begin{bmatrix} 4 \\ 10 \end{bmatrix} - \begin{bmatrix} 3 \\ 9 \end{bmatrix} = \begin{bmatrix} 1 \\ 1 \end{bmatrix} \implies \text{squared distance} = (1)^2 + (1)^2 = 2
Thus, the inertia for cluster 1 is 2 + 2 + 2 + 2 = 8.
We follow a similar procedure for cluster 2:
\begin{bmatrix} 7 \\ 1 \end{bmatrix} - \begin{bmatrix} 8 \\ 2 \end{bmatrix} = \begin{bmatrix} -1 \\ -1 \end{bmatrix} \implies \text{squared distance} = (-1)^2 + (-1)^2 = 2
\begin{bmatrix} 8 \\ 4 \end{bmatrix} - \begin{bmatrix} 8 \\ 2 \end{bmatrix} = \begin{bmatrix} 0 \\ 2 \end{bmatrix} \implies \text{squared distance} = (0)^2 + (2)^2 = 4
\begin{bmatrix} 9 \\ 1 \end{bmatrix} - \begin{bmatrix} 8 \\ 2 \end{bmatrix} = \begin{bmatrix} 1 \\ -1 \end{bmatrix} \implies \text{squared distance} = (-1)^2 + (1)^2 = 2
Thus, the inertia for cluster 2 is 2 + 4 + 2 = 8.
This means that the total inertia for the whole dataset is 8 + 8 = 16.
You run the k-means clustering algorithm on a dataset and it converges to a certain clustering with associated inertia I. You then duplicate each data point in the dataset and run k-means again on this twice-as-big dataset, with the same initial centroids as before. Which of the following is true? Select all that apply.
The inertia will be the same as before, I.
The inertia will be twice as much as before, 2I.
The centroids found will be the same as before.
None of the above.
Answers:
The centroids found will be the same as before because the dataset has been duplicated, but they have not moved! This means k means clustering will find the same clusters as before. You can imagine it like points overlapping each other.
The inertia will be twice as much before 2I because of how inertia is calculated. Recall inertia measures how well a dataset is clustered and is calculated by measuring the total squared distance from each point to its closest centroid. Since the total number of points has doubled, even though each (unique) point is still assigned to the same centroid, the total squared distance has doubled.