← return to study.practicaldsc.org
The problems in this worksheet are taken from past exams in similar classes. Work on them on paper, since the exams you take in this course will also be on paper.
Neerad wants to build a model that predicts the number of open rooms a hotel has, given various other features. He has a training set with 1200 rows available to him for the purposes of training his model.
Neerad fits a regression model using the GPTRegression
class. GPTRegression models have several hyperparameters
that can be tuned, including context_length and
sentience.
To choose between 5 possible values of the hyperparameter
context_length, Neerad performs k-fold cross-validation.
GPTRegression model fit?4k
5k
240k
6000k
4(k − 1)
5(k − 1)
240(k − 1)
6000(k − 1)
GPTRegression model is fit,
it appends the number of points in its training set to the list
sizes. Note that after performing cross- validation,
len(sizes) is equal to your answer to the previous
subpart.What is sum(sizes)?
4k
5k
240k
6000k
4(k − 1)
5(k − 1)
240(k − 1)
6000(k − 1)
Answers:
When we do k-fold cross-validation for one single hyperparameter value, we split the dataset into k folds, and in each iteration i, train the model on the remaining k-1 folds and evaluate on fold i. Since every fold is left out and evaluated on once, the model is fit in total k times. We do this once for every hyperparameter value we want to test, so the total number of model fits required is 5k.
In part 2, we can note that each model fit is performed on the same size of data – the size of the remaining k-1 folds when we hold out a single fold. This size is 1 - \frac{1}{k} = \frac{k-1}{k} times the size of the entire dataset, in this case, 1200 \cdot \frac{k-1}{k}, and we fit a model on a dataset of this size 5k times. So, the sum of the training sizes for each model fit is:
5k \cdot \frac{k-1}{k} \cdot 1200 = 6000(k-1)
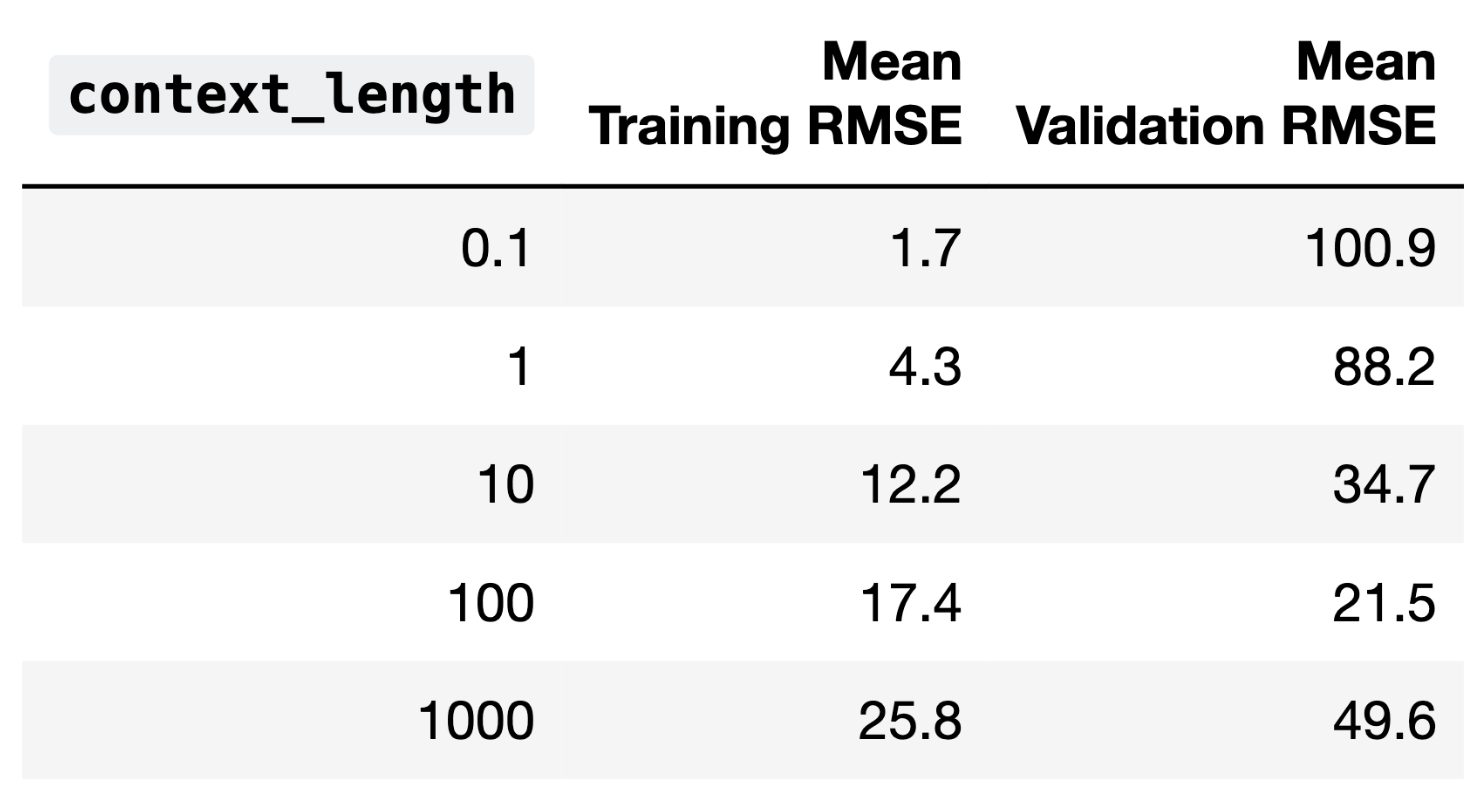
The average training error and validation error for all 5 candidate
values of context_length are given below.
Fill in the blanks: As context_length increases, model
complexity __(i)__. The optimal choice of
context_length is __(ii)__; if we choose a
context_length any higher than that, our model will
__(iii)__.
increases
decreases
0.1
1
10
100
1000
overfit the training data and have high bias
underfit the training data and have high bias
overfit the training data and have low bias
underfit the training data and have low bias
Answers:
In part 1, we can see that as context_length increases,
the training error increases, and the model performs worse. In general,
higher model complexity leads to better model performance, so here,
increasing context_length is reducing model
complexity.
In part 2, we will choose a context_length of 100, since
this parameterization leads to the best validation performance. If we
increase context_length further, the validation error
increases.
In part 3, since increased context_length indicates
less complexity and worse training performance, increasing the
context_length further would lead to underfitting, as the
model would lack the expressiveness or number of parameters required to
capture the data. Since training error represents model bias, and since
high variance is associated with overfitting, a further
increase in context_length would mean a more biased
model.
Consider the least squares regression model, \vec{h} = X \vec{w}. Assume that X and \vec{h} refer to the design matrix and hypothesis vector for our training data, and \vec y is the true observation vector.
Let \vec{w}_\text{OLS}^* be the parameter vector that minimizes mean squared error without regularization. Specifically:
\vec{w}_\text{OLS}^* = \arg\underset{\vec{w}}{\min} \frac{1}{n} \| \vec{y} - X \vec{w} \|^2_2
Let \vec{w}_\text{ridge}^* be the parameter vector that minimizes mean squared error with L_2 regularization, using a non-negative regularization hyperparameter \lambda (i.e. ridge regression). Specifically:
\vec{w}_\text{ridge}^* = \arg\underset{\vec{w}}{\min} \frac{1}{n} \| \vec y - X \vec{w} \|^2_2 + \lambda \sum_{j=1}^{p} w_j^2
For each of the following problems, fill in the blank.
If we set \lambda = 0, then \Vert \vec{w}_\text{OLS}^* \Vert^2_2 is ____ \Vert \vec{w}_\text{ridge}^* \Vert^2_2
less than
equal to
greater than
impossible to tell
Answers:
equal to
For each of the remaining parts, you can assume that \lambda is set such that the predicted response vectors for our two models (\vec{h} = X \vec{w}_\text{OLS}^* and \vec{h} = X \vec{w}_\text{ridge}^*) is different.
The training MSE of the model \vec{h} = X \vec{w}_\text{OLS}^* is ____ than the model \vec{h} = X \vec{w}_\text{ridge}^*.
less than
equal to
greater than
impossible to tell
Answers:
less than
Now, assume we’ve fit both models using our training data, and evaluate both models on some unseen testing data.
The test MSE of the model \vec{h} = X \vec{w}_\text{OLS}^* is ____ than the model \vec{h} = X \vec{w}_\text{ridge}^*.
less than
equal to
greater than
impossible to tell
Answers:
impossible to tell
Assume that our design matrix X contains a column of all ones. The sum of the residuals of our model \vec{h} = X \vec{w}_\text{ridge}^* ____.
equal to 0
not necessarily equal to 0
Answers:
not necessarily equal to 0
As we increase \lambda, the bias of the model \vec{h} = X \vec{w}_\text{ridge}^* tends to ____.
increase
stay the same
decrease
Answers:
increase
As we increase \lambda, the model variance of the model \vec{h} = X \vec{w}_\text{ridge}^* tends to ____.
increase
stay the same
decrease
Answers:
decrease
As we increase \lambda, the observation variance of the model \vec{h} = X \vec{w}_\text{ridge}^* tends to ____.
increase
stay the same
decrease
Answers:
stay the same
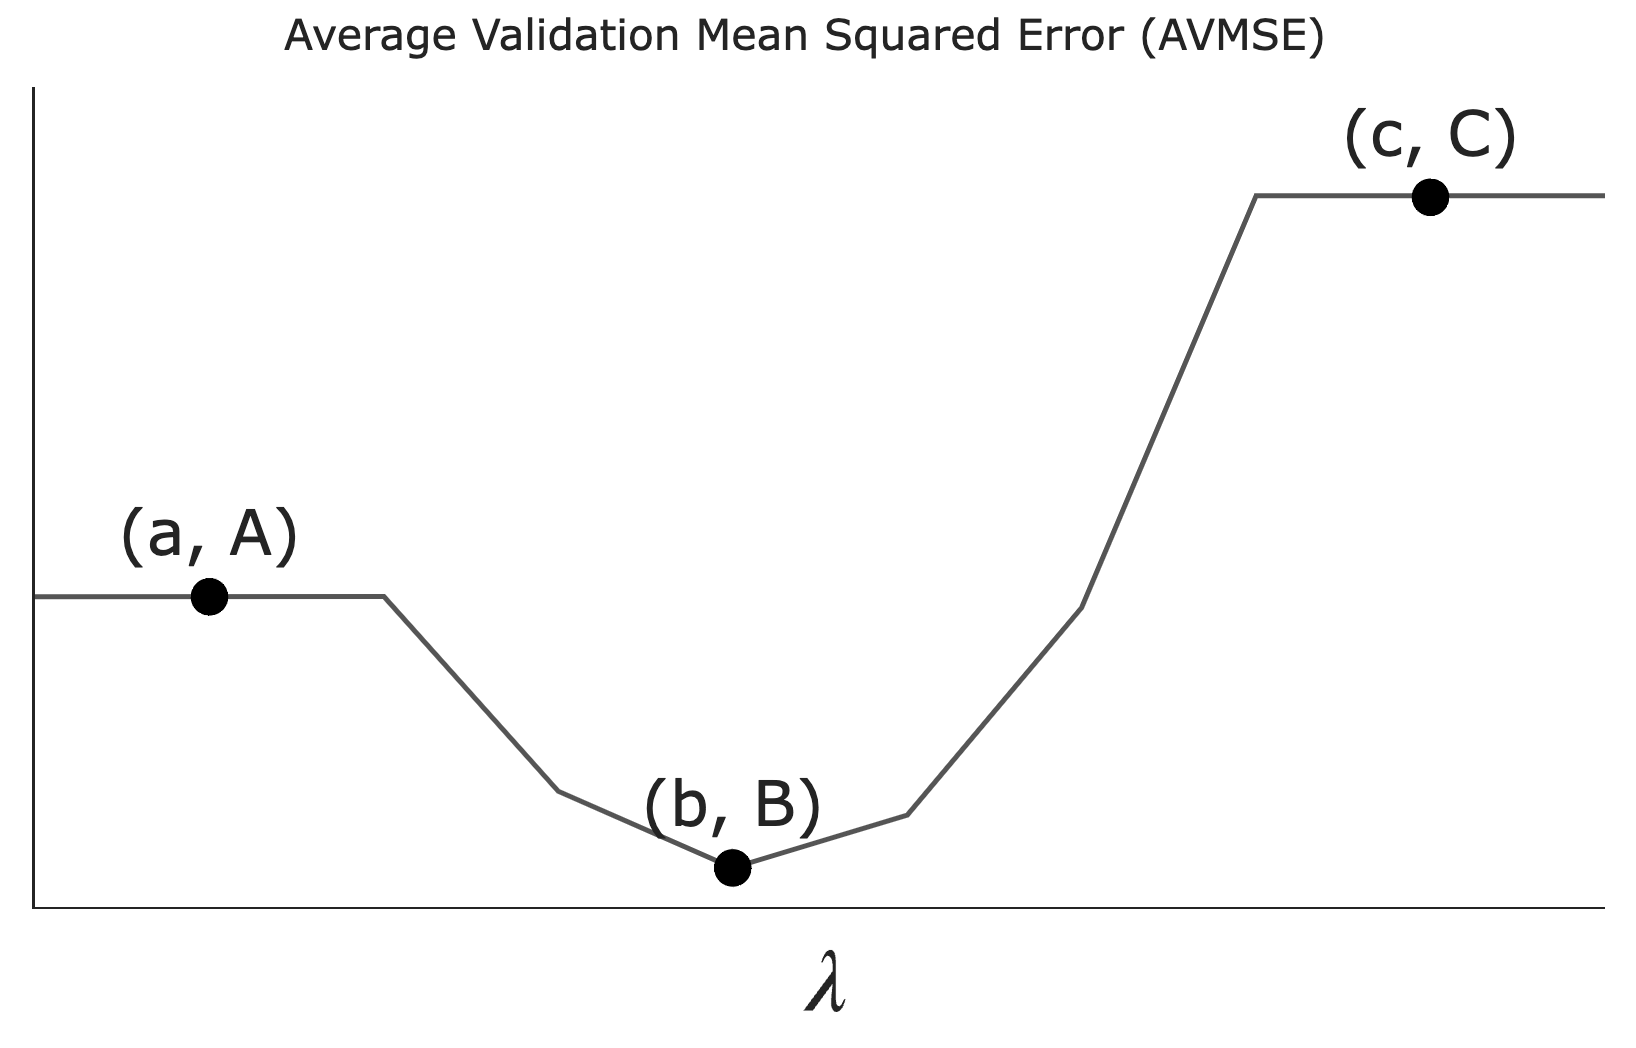
Suppose we want to use LASSO (i.e. minimize mean squared error with L_1 regularization) to fit a linear model that predicts the number of ingredients in a product given its price and rating.
Let \lambda be a non-negative regularization hyperparameter. Using cross-validation, we determine the average validation mean squared error — which we’ll refer to as AVMSE in this question — for several different choices of \lambda. The results are given below.
As \lambda increases, what happens to model complexity and model variance?
Model complexity and model variance both increase.
Model complexity increases while model variance decreases.
Model complexity decreases while model variance increases.
Model complexity and model variance both decrease.
Answer: Model complexity and model variance both decrease.
As \lambda increases, the L_1 regularization penalizes larger coefficient values more heavily, forcing the model to forget the details in the training data and focus on the bigger picture. This effectively reduces the number of non-zero coefficients, decreasing model complexity. Since model complexity and model variance are the same thing, variance also decreases.
What does the value A on the graph above correspond to?
The AVMSE of the \lambda we’d choose to use to train a model.
The AVMSE of an unregularized multiple linear regression model.
The AVMSE of the constant model.
Answer: The AVMSE of an unregularized multiple linear regression model.
Point A represents the case where \lambda = 0, meaning no regularization is applied. This corresponds to an unregularized multiple linear regression model.
What does the value B on the graph above correspond to?
The AVMSE of the \lambda we’d choose to use to train a model.
The AVMSE of an unregularized multiple linear regression model.
The AVMSE of the constant model.
Answer: The AVMSE of the \lambda we’d choose to use to train a model.
Point B is the minimum point on the graph, indicating the optimal \lambda value that minimizes the AVMSE. This is because we don’t typically regularize the intercept term’s coefficient, w_0^*.
What does the value C on the graph above correspond to?
The AVMSE of the \lambda we’d choose to use to train a model.
The AVMSE of an unregularized multiple linear regression model.
The AVMSE of the constant model.
Answer: The AVMSE of the constant model.
Point C represents the AVMSE when \lambda is very large, effectively forcing all coefficients to zero. This corresponds to the constant model.
Suppose we build a binary classifier that uses a song’s
"track_name" and "artist_names" to predict
whether its genre is "Hip-Hop/Rap" (1) or not (0).
For our classifier, we decide to use a brand-new model built into
sklearn called the
BillyClassifier. A BillyClassifier instance
has three hyperparameters that we’d like to tune. Below, we show a
dictionary containing the values for each hyperparameter that we’d like
to try:
hyp_grid = {
  "radius": [0.1, 1, 2, 3, 4, 5, 6, 7, 8, 9, 10, 100], # 12 total
  "inflection": [-5, -4, -3, -2, -1, 0, 1, 2, 3, 4], # 10 total
  "color": ["red", "yellow", "green", "blue", "purple"] # 5 total
}
To find the best combination of hyperparameters for our
BillyClassifier, we first conduct a train-test split, which
we use to create a training set with 800 rows. We then use
GridSearchCV to conduct k-fold cross-validation for each combination
of hyperparameters in hyp_grid, with k=4.
When we call GridSearchCV, how many times is a
BillyClassifier instance trained in total? Give your answer
as an integer.
Answer: 2400
There are 12 \cdot 10 \cdot 5 = 600
combinations of hyperparameters. For each combination of
hyperparameters, we will train a BillyClassifier with that
combination of hyperparameters k = 4
times. So, the total number of BillyClassifier instances
that will be trained is 600 \cdot 4 =
2400.
In each of the 4 folds of the data, how large is the training set, and how large is the validation set? Give your answers as integers.
size of training set =
size of validation set =
Answer: 600, 200
Since we performed k=4 cross-validation, we must divide the training set into four disjoint groups each of the same size. \frac{800}{4} = 200, so each group is of size 200. Each time we perform cross validation, one group is used for validation, and the other three are used for training, so the validation set size is 200 and the training set size is 200 \cdot 3 = 600.
Suppose that after fitting a GridSearchCV instance, its
best_params_ attribute is
{"radius": 8, "inflection": 4, "color": "blue"}Select all true statements below.
The specific combination of hyperparameters in
best_params_ had the highest average training accuracy
among all combinations of hyperparameters in hyp_grid.
The specific combination of hyperparameters in
best_params_ had the highest average validation accuracy
among all combinations of hyperparameters in hyp_grid.
The specific combination of hyperparameters in
best_params_ had the highest training accuracy among all
combinations of hyperparameters in hyp_grid, in each of the
4 folds of the training data.
The specific combination of hyperparameters in
best_params_ had the highest validation accuracy among all
combinations of hyperparameters in hyp_grid, in each of the
4 folds of the training data.
A BillyClassifier that is fit using the specific
combination of hyperparameters in best_params_ is
guaranteed to have the best accuracy on unseen testing data among all
combinations of hyperparameters in hyp_grid.
Answer: Option B
When performing cross validation, we select the combination of
hyperparameters that had the highest average validation
accuracy across all four folds of the data. That is, by
definition, how best_params_ came to be. None of the other
options are guaranteed to be true.
We will aim to build a classifier that takes in demographic information about a state from a particular year and predicts whether or not the state’s mean math score is higher than its mean verbal score that year.
In honor of the
rotisserie
chicken event on UCSD’s campus in March of 2023,
sklearn released a new classifier class called
ChickenClassifier.
ChickenClassifiers have many hyperparameters, one of
which is height. As we increase the value of
height, the model variance of the resulting
ChickenClassifier also increases.
First, we consider the training and testing accuracy of a
ChickenClassifier trained using various values of
height. Consider the plot below.

Which of the following depicts training accuracy
vs. height?
Option 1
Option 2
Option 3
Which of the following depicts testing accuracy
vs. height?
Option 1
Option 2
Option 3
Answer: Option 2 depicts training accuracy
vs. height; Option 3 depicts testing accuract
vs. height
We are told that as height increases, the model variance
(complexity) also increases.
As we increase the complexity of our classifier, it will do a better
job of fitting to the training set because it’s able to “memorize” the
patterns in the training set. As such, as height increases,
training accuracy increases, which we see in Option 2.
However, after a certain point, increasing height will
make our classifier overfit too closely to our training set and not
general enough to match the patterns in other similar datasets, meaning
that after a certain point, increasing height will actually
decrease our classifier’s accuracy on our testing set. The only option
that shows accuracy increase and then decrease is Option 3.
ChickenClassifiers have another hyperparameter,
color, for which there are four possible values:
"yellow", "brown", "red", and
"orange". To find the optimal value of color,
we perform k-fold cross-validation with
k=4. The results are given in the table
below.

Which value of color has the best average validation
accuracy?
"yellow"
"brown"
"red"
"orange"
Answer: "red"
From looking at the results of the k-fold cross validation, we see that the color red has the highest, and therefore the best, validation accuracy as it has the highest row mean (across all 4 folds).
True or False: It is possible for a hyperparameter value to have the best average validation accuracy across all folds, but not have the best validation accuracy in any one particular fold.
True
False
Answer: True
An example is shown below:
| color | Fold 1 | Fold 2 | Fold 3 | Fold 4 | average |
|---|---|---|---|---|---|
| color 1 | 0.8 | 0 | 0 | 0 | 0.2 |
| color 2 | 0 | 0.6 | 0 | 0 | 0.15 |
| color 3 | 0 | 0 | 0.1 | 0 | 0.025 |
| color 4 | 0 | 0 | 0 | 0.2 | 0.05 |
| color 5 | 0.7 | 0.5 | 0.01 | 0.1 | 0.3275 |
In the example, color 5 has the highest average validation accuracy across all folds, but is not the best in any one fold.
Now, instead of finding the best height and best
color individually, we decide to perform a grid search that
uses k-fold cross-validation to find
the combination of height and color with the
best average validation accuracy.
For the purposes of this question, assume that:
height and h_2 possible
values of color.Consider the following three subparts:
Choose from the following options.
k
\frac{k}{n}
\frac{n}{k}
\frac{n}{k} \cdot (k - 1)
h_1h_2k
h_1h_2(k-1)
\frac{nh_1h_2}{k}
None of the above
Answer: A: Option 3 (\frac{n}{k}), B: Option 6 (h_1h_2(k-1)), C: Option 8 (None of the above)
The training set is divided into k folds of equal size, resulting in k folds with size \frac{n}{k}.
For each combination of hyperparameters, row 5 is k - 1 times for training and 1 time for validation. There are h_1 \cdot h_2 combinations of hyperparameters, so row 5 is used for training h_1 \cdot h_2 \cdot (k-1) times.
Building off of the explanation for the previous subpart, row 5 is used for validation 1 times for each combination of hyperparameters, so the correct expression would be h_1 \cdot h_2, which is not a provided option.
Suppose you fit four different models to predict whether someone has an income greater than $100,000 a year using their purchase history. You split the data into a training and test set and use 3-fold cross-validation. The table below shows all the calculated accuracies for each model (higher accuracy is better).
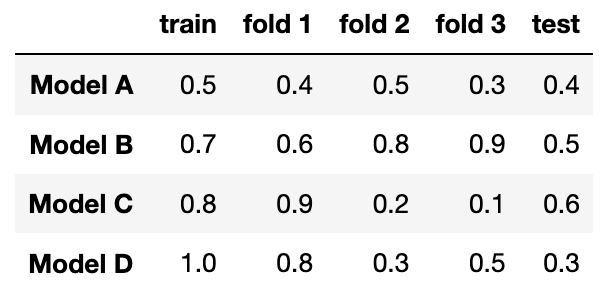
Which model has the lowest model bias?
Model A
Model B
Model C
Model D
Answer: Model D
Which model most severely underfits the data?
Model A
Model B
Model C
Model D
Answer: Model A
Which model most severely overfits the data?
Model A
Model B
Model C
Model D
Answer: Model D
Which model should you pick overall?
Model A
Model B
Model C
Model D
Answer: Model B