
← return to study.practicaldsc.org
The problems in this worksheet are taken from past exams in similar classes. Work on them on paper, since the exams you take in this course will also be on paper.
In September 2020, Governor Gavin Newsom announced that by 2035, all new vehicles sold in California must be zero-emissions vehicles. Electric vehicles (EVs) are among the most popular zero-emissions vehicles (though other examples include plug-in hybrids and hydrogen fuel cell vehicles).
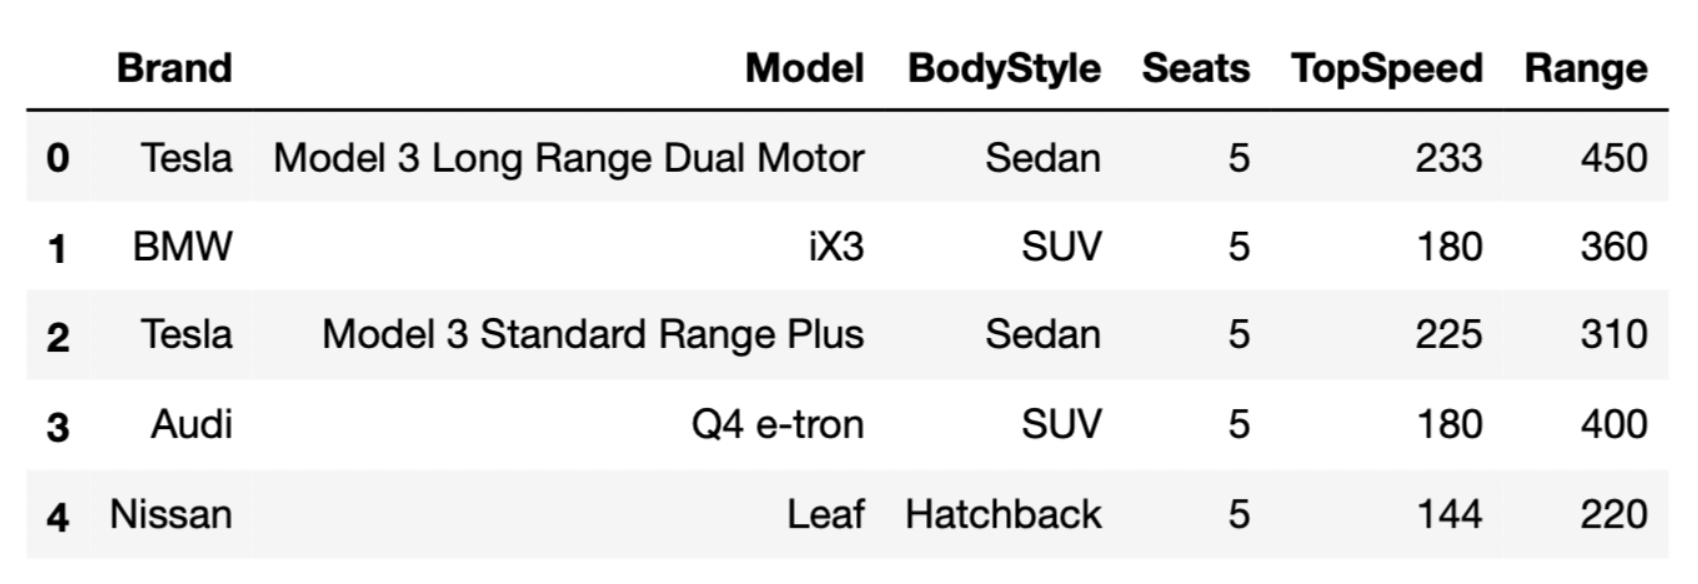
The DataFrame evs consists of 32 rows,
each of which contains information about a different EV model.
"Brand" (str): The vehicle’s manufacturer."Model" (str): The vehicle’s model name."BodyStyle" (str): The vehicle’s body style."Seats" (int): The vehicle’s number of seats."TopSpeed" (int): The vehicle’s top speed, in
kilometers per hour."Range" (int): The vehicle’s range, or distance it can
travel on a single charge, in kilometers.The first few rows of evs are shown below (though
remember, evs has 32 rows total).
Throughout this problem, we will refer to evs
repeatedly.
Assume that:
"Brand" column are
"Tesla", "BMW", "Audi", and
"Nissan".import pandas as pd and
import numpy as np.Tip: Open this page in another tab, so that it is easy to refer to this data description as you work through the problem.
Which of the following types of visualizations could use to visualize
the distribution of "Range"? Select all that apply.
Bar chart
Histogram
Scatter plot
Line plot
Box plot
None of the above
Answer: Histogram or box plot
"Range" is a numerical (i.e. quantitative) variable, and
we use histograms and box plots to visualize the distribution of
numerical features.
"Range" is not
categorical."Range").Teslas, on average, tend to have higher "Range"s than
BMWs. In which of the following visualizations would we be able to see
this pattern? Select all that apply.
A bar chart that shows the distribution of "Brand"
A bar chart that shows the average "Range" for each
"Brand"
An overlaid histogram showing the distribution of
"Range" for each "Brand"
A scatter plot with "TopSpeed" on the x-axis and "Range" on the y-axis
Answer:
"Range" for each
"Brand""Range" for each "Brand"Let’s look at each option more closely.
Option 1: A bar chart showing the distribution
of "Brand" would only show us how many cars of each
"Brand" there are. It would not tell us anything about the
average "Range" of each "Brand".
Option 2: A bar chart showing the average range
for each "Brand" would help us directly visualize how the
average range of each "Brand" compares to one
another.
Option 3: An overlaid histogram, although
perhaps a bit messy, would also give us a general idea of the average
range of each "Brand" by giving us the distribution of the
"Range" of each brand. In the scenario mentioned in the
question, we’d expect to see that the Tesla distribution is further
right than the BMW distribution.
Option 4: A scatter plot of
"TopSpeed" against "Range" would only
illustrate the relationship between "TopSpeed" and
"Range", but would contain no information about the
"Brand" of each EV.
Kyle thinks "Seats" is a categorical feature because it
can be used to categorize EVs by size. For instance, EVs with 4 seats
are small, EVs with 5 seats are medium, and EVs with 6 or more seats are
large.
Is Kyle correct?
Yes
No
Justify your answer in one sentence. Your answer must fit in the box below.
Answer: No
"Seats" is a numerical feature, since it makes sense to
do arithmetic with the values. For instance, we can find the average
number of "Seats" that a group of cars has. Kyle’s argument
could apply to any numerical feature; just because we can place
numerical features into “bins” doesn’t make them categorical.
The seat-back TV on one of Biff the Wolverine’s more recent flights
was very dirty and was full of fingerprints. The fingerprints made an
interesting pattern. We’ve stored the x and y positions of each
fingerprint in the DataFrame fingerprints, and created the
following scatterplot using
fingerprints.plot(kind='scatter', x='x', y='y')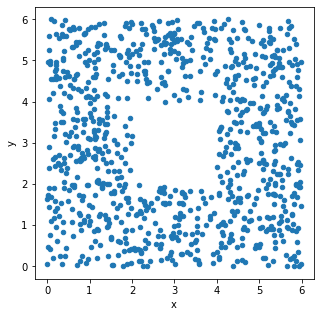
True or False: The histograms that result from the following two lines of code will look very similar.
# When we say bins=np.arange(0, 8, 2),
# we mean that the bins are [0, 2), [2, 4), [4, 6].
fingerprints.plot(kind='hist',
                  y='x',
                  density=True,
                  bins=np.arange(0, 8, 2))
and
fingerprints.plot(kind='hist',
                  y='y',
                  density=True,
                  bins=np.arange(0, 8, 2))
True
False
Answer: True
The only difference between the two code snippets is the data values
used. The first creates a histogram of the x-values in
fingerprints, and the second creates a histogram of the
y-values in fingerprints.
Both histograms use the same bins:
bins=np.arange(0, 8, 2). This means the bin endpoints are
[0, 2, 4, 6], so there are three distinct bins: [0, 2), [2,
4), and [4, 6]. Remember the
right-most bin of a histogram includes both endpoints, whereas others
include the left endpoint only.
Let’s look at the x-values first. If we divide the
scatterplot into nine equally-sized regions, as shown below, note that
eight of the nine regions have a very similar number of data points.
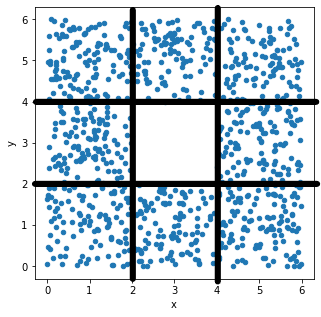
Aside from the middle region, about \frac{1}{8} of the data falls in each region.
That means \frac{3}{8} of the data has
an x-value in the first bin [0,
2), \frac{2}{8} of the data has
an x-value in the middle bin [2,
4), and \frac{3}{8} of the data
has an x-value in the rightmost bin [4, 6]. This distribution of
x-values into bins determines what the histogram will look
like.
Now, if we look at the y-values, we’ll find that \frac{3}{8} of the data has a
y-value in the first bin [0,
2), \frac{2}{8} of the data has
a y-value in the middle bin [2,
4), and \frac{3}{8} of the data
has a y-value in the last bin [4,
6]. That’s the same distribution of data into bins as the
x-values had, so the histogram of y-values
will look just like the histogram of y-values.
Alternatively, an easy way to see this is to use the fact that the
scatterplot is symmetric over the line y=x, the line that makes a 45 degree angle
with the origin. In other words, interchanging the x and
y values doesn’t change the scatterplot noticeably, so the
x and y values have very similar
distributions, and their histograms will be very similar as a
result.
Below, we’ve drawn a histogram using the line of code
fingerprints.plot(kind='hist',
                  y='x',
                  density=True,
                  bins=np.arange(0, 8, 2))
However, our Jupyter Notebook was corrupted, and so the resulting histogram doesn’t quite look right. While the height of the first bar is correct, the histogram doesn’t contain the second or third bars, and the y-axis is replaced with letters.
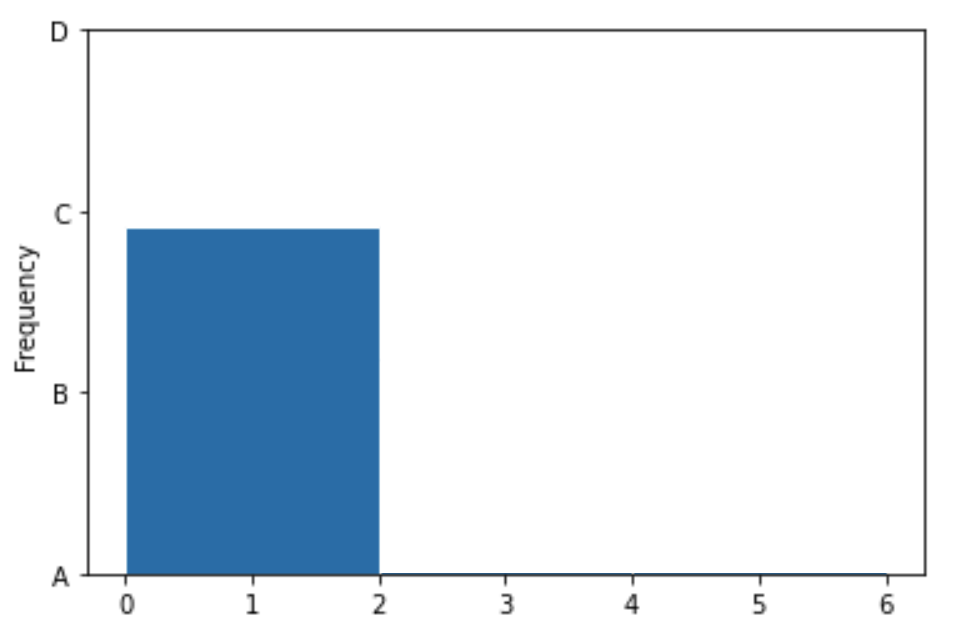
Which of the four options on the y-axis is closest to where the height of the middle bar should be?
A
B
C
D
Which of the four options on the y-axis is closest to where the height of the rightmost bar should be?
A
B
C
D
Answer: B, then C
We’ve already determined that the first bin should contain \frac{3}{8} of the values, the middle bin should contain \frac{2}{8} of the values, and the rightmost bin should contain \frac{3}{8} of the values. The middle bar of the histogram should therefore be two-thirds as tall as the first bin, and the rightmost bin should be equally as tall as the first bin. The only reasonable height for the middle bin is B, as it’s closest to two-thirds of the height of the first bar. Similarly, the rightmost bar must be at height C, as it’s the only one close to the height of the first bar.
Pranavi proposes the following imputation scheme.
    def impute(s):
return s.fillna(np.random.choice(s[s.notna()]))True or False: impute performs
probabilistic imputation, using the same definition of probabilistic
imputation we learned about in class.
True
False
Answer: False
In impute, np.random.choice will return a
single non-null value from s, and .fillna()
will fill every null value with this single value. Meanwhile,
probabilistic imputation draws a different value from a specified
distribution to fill each missing value, making it such that there won’t
be a single “spike” in the imputed distribution at a single chosen
value.
Consider the following expressions and values.
    >>> vals.isna().mean()
    0.2
    >>> vals.describe().loc[["min", "mean", "max"]]
    min     2.0
    mean    4.0
    max     7.0
    dtype: float64
Given the above, what is the maximum possible value
of impute(vals).mean()? Give your answer as a number
rounded to one decimal place.
Answer: 4.6
The maximum possible value of impute(vals).mean() would
occur when every single missing value in vals is filled in
with the highest possible non-null value in vals. (As
discussed in the previous solution, impute selects only one
value from s to fill into every missing space.)
If this occurs, then the mean of the imputed Series will be weighted mean of the available data and the filled data, and given the numbers in the question, this is 0.8 \cdot 4 + 0.2 \cdot 7, or 4.6.
Which of the following statements below will always evaluate to
True?
vals.std() < impute(vals).std()
vals.std() <= impute(vals).std()
vals.std() == impute(vals).std()
vals.std() >= impute(vals).std()
vals.std() > impute(vals).std()
None of the above
Answer: None of the above
Since the value which impute will choose to impute with
is random, the effect that it has on the standard deviation of
vals is unknown. If the missing values are filled with a
value close to the mean, this could reduce standard deviation; if they
are filled with a value far from the mean, this could increase standard
deviation. (Of course, the imputation will also shift the mean, so
without knowing details of the Series, it’s impossible to come up with
thresholds.) In any case, since the value for imputation is chosen at
random, none of these statements will always be true, and so
the correct answer is “none of the above.”
Suppose we have a DataFrame, dogs, in which each row
corresponds to a different dog owned by someone in Ann Arbor. There are
several columns in the DataFrame, including "birth_year"
(the dog’s year of birth) and "Breed" (the dog’s
breed).
Using the "birth_year" column in dogs,
Tahseen computes the age of each dog and stores it a new
"age" column of dogs. He also categorizes dogs
into three “breed classes” based on their breed –
"Retriever", "Terrier", or
"Other" – and stores these in a new "class"
column of dogs.
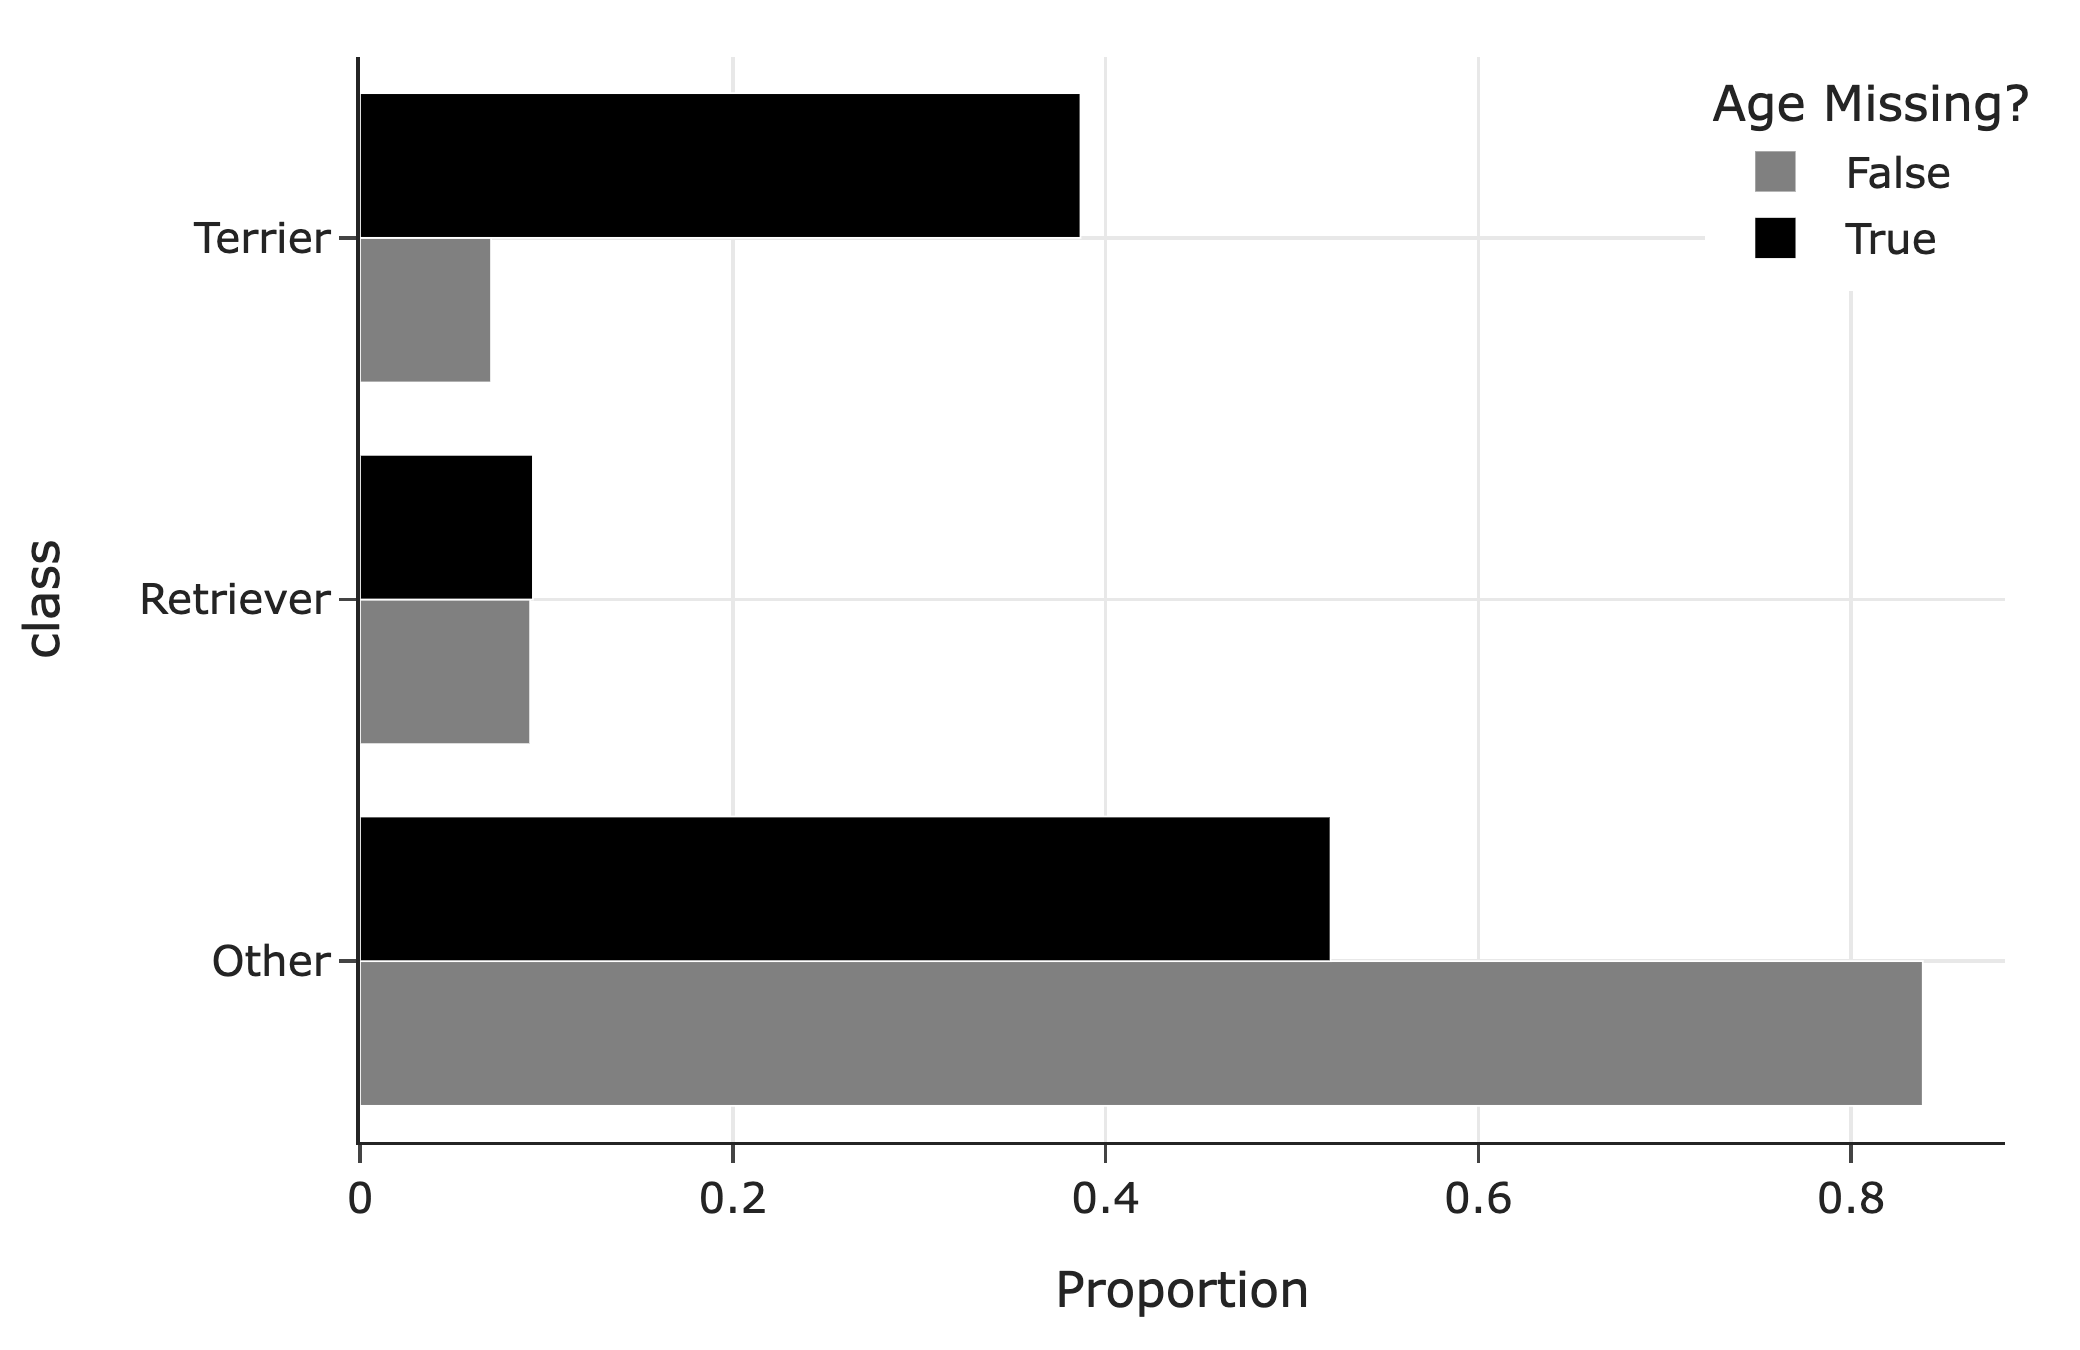
The following bar chart shows the distribution of breed classes by missingness of age:
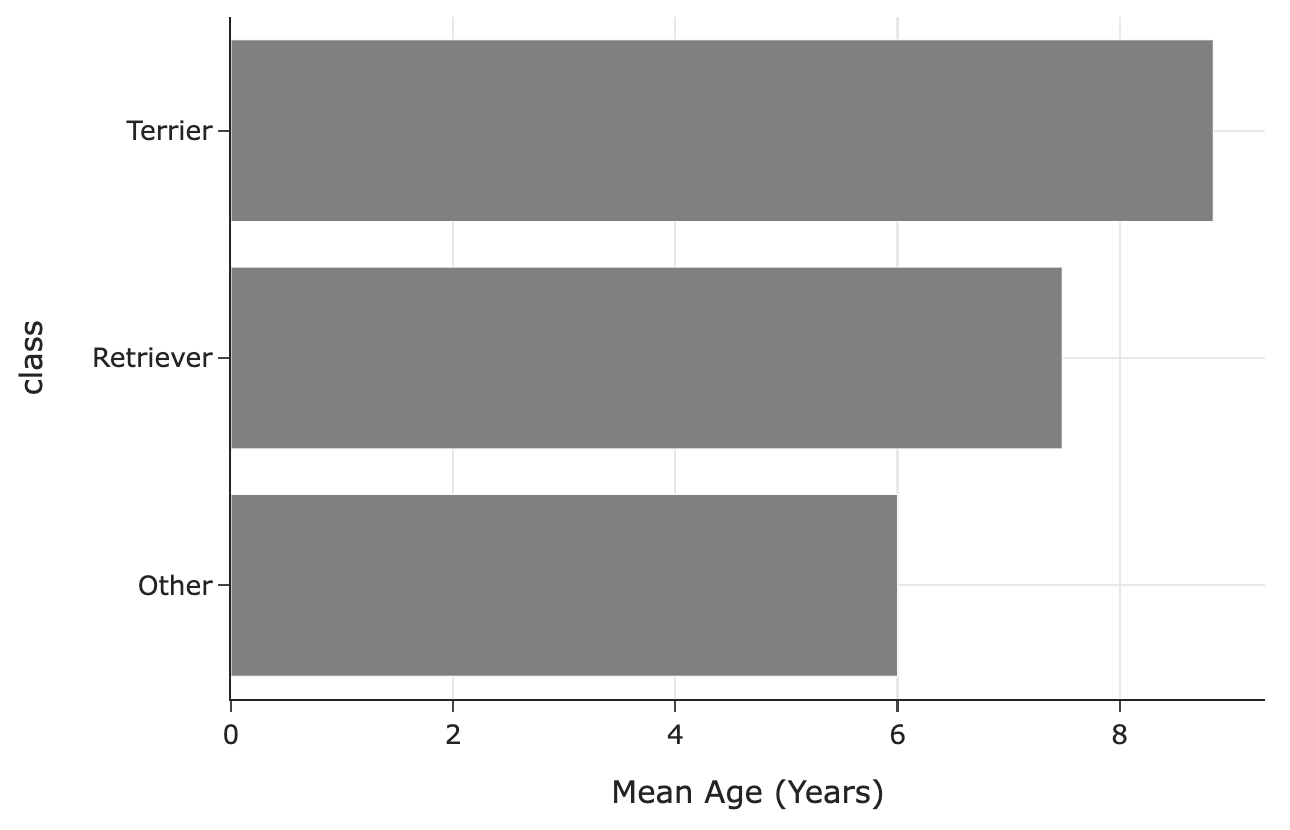
The following bar chart shows the mean observed age for each breed class:
Let O be the mean of the observed
ages in dogs, that is, the mean of the ages that aren’t
missing. Let T be the true mean of the
ages in dogs, that is, the mean we’d compute if none of the
ages were missing.
What is the relationship between O and T?
O < T
O \approx T
O = T
O > T
Answer: O < T
In the ages we get to observe (that is, when age is not missing), we have way fewer terrier values than in the ages we don’t get to observe. Terriers are older on average than the other breed classes. This means we’re missing values that are larger, so when we take the average of the values we have access to, it’ll be lower than the true mean.
Consider the following strategy for imputing missing ages.
def fill_missing(dogs):
  return dogs.assign(
    age=dogs.groupby("class")["age"]
            .transform(lambda x: x.fillna(x.value_counts().idxmax()))
)In one sentence, describe this imputation strategy.
Answer: This is filling in missing ages in each breed class with the most common observed age in that breed class.
small_dogs is a subset of dogs shown in its
entirety below.
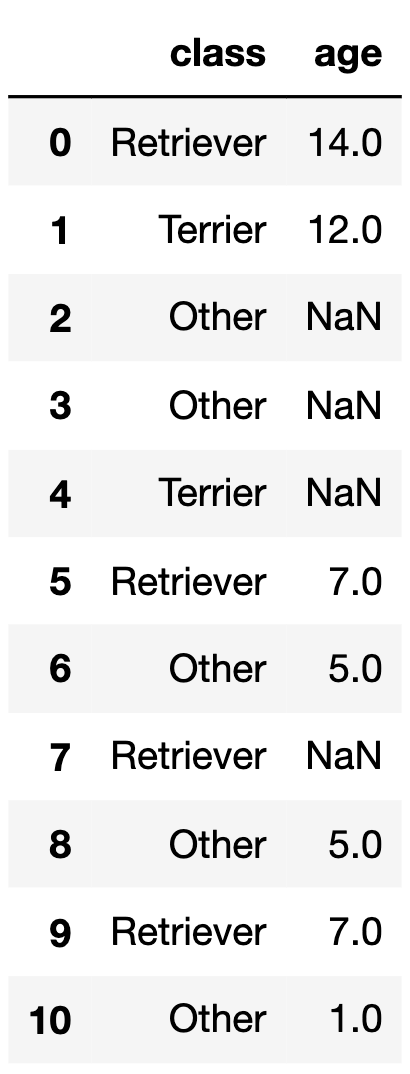
If we call fill_missing on small_dogs, what
values would the four null values in the "age" column of
small_dogs be replaced with?
Answer:
"Other"
breed class is 5."Other"
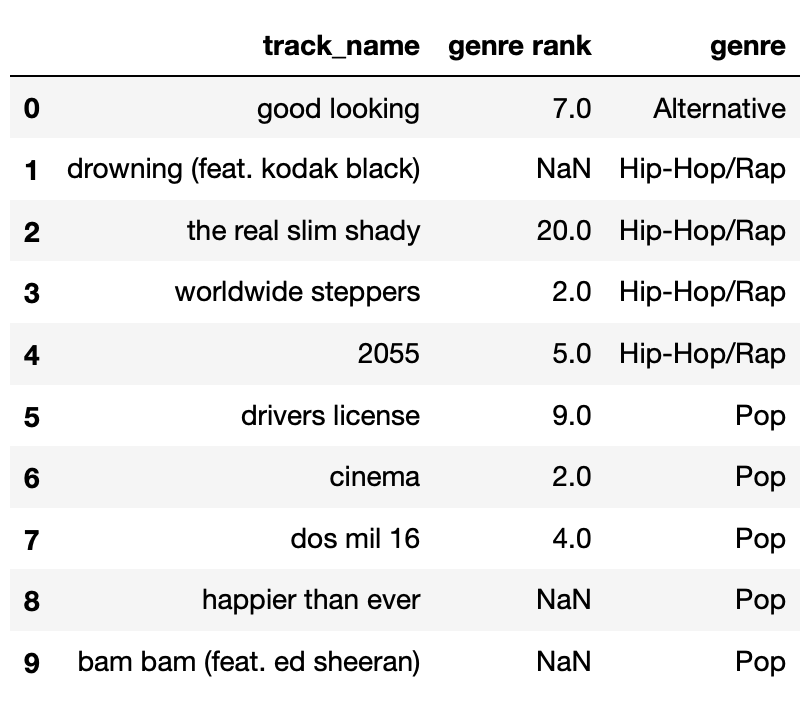
breed class is 5."Terrier" breed class is 12."Retriever" breed class is 7.The DataFrame random_10 contains the
"track_name" and "genre" of 10 randomly-chosen
songs in Spotify’s Top 200 today, along with their
"genre_rank", which is their rank in the Top 200
among songs in their "genre". For
instance, “the real slim shady" is the 20th-ranked Hip-Hop/Rap song in
the Top 200 today. random_10 is shown below in its
entirety.
The "genre_rank" column of random_10
contains missing values. Below, we provide four different imputed
"genre_rank" columns, each of which was created using a
different imputation technique. On the next page, match each of the four
options to the imputation technique that was used in the option.
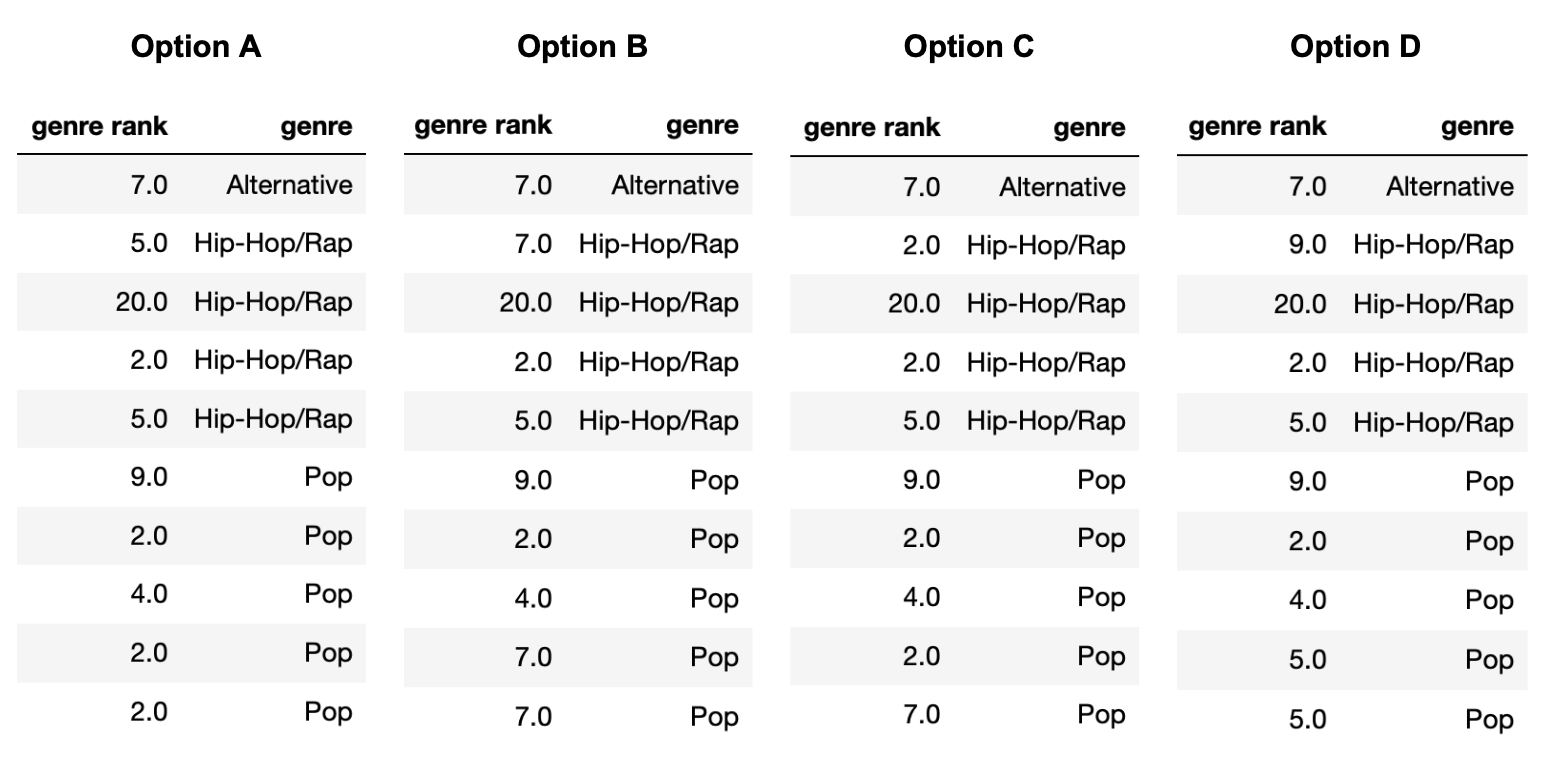
Note that each option (A, B, C, D) should be used exactly once between parts (a) and (d).
In which option was unconditional mean imputation used?
Answer: Option B
Explanation given in part d) below
In which option was mean imputation conditional on
"genre" used?
Answer: Option D
Explanation given in part d) below
In which option was unconditional probabilistic imputation used?
Answer: Option C
Explanation given in part d) below
In which option was probabilistic imputation conditional on
"genre" used?
Answer: Option A
First, note that in Option B, all three missing values are filled
in with the same number, 7. The mean of the observed values in
random_10["genre_rank"] is 7, so we must have performed
unconditional mean imputation in Option B. (Technically, it’s possible
for Option B to be the result of unconditional probabilistic imputation,
but we stated that each option could only be used once, and there is
another option that can only be unconditional probabilistic
imputation.)
Then note that in Option C, the very last missing value (in the
"Pop" "genre") is filled in with a 7, which is
not the mean of the observed "Pop" values, but rather a
value from the "Alternative" "genre". This
must mean that unconditional probabilistic imputation was used in Option
C, since that’s the only way a value from a different group can be used
for imputation (if we are not performing some sort of mean
imputation).
This leaves Option A and Option D. The last two missing values
(the two in the "Pop" "genre") are both filled
in with the same value, 2 in Option A and 5 in Option D. The mean of the
observed values for the "Pop" "genre" is \frac{9+2+4}{3} = 5, so mean imputation
conditional on "genre" must have been used in Option D and
thus probabilistic imputation conditional on "genre" must
have been used in Option A.
After taking the SAT, Nicole wants to check the College Board’s website to see her score. However, the College Board recently updated their website to use non-standard HTML tags and Nicole’s browser can’t render it correctly. As such, she resorts to making a GET request to the site with her scores on it to get back the source HTML and tries to parse it with BeautifulSoup.
Suppose soup is a BeautifulSoup object instantiated
using the following HTML document.
<college>Your score is ready!</college>

<sat verbal="ready" math="ready">
  Your percentiles are as follows:
  <scorelist listtype="percentiles">
    <scorerow kind="verbal" subkind="per">
      Verbal: <scorenum>84</scorenum>
    </scorerow>
    <scorerow kind="math" subkind="per">
      Math: <scorenum>99</scorenum>
    </scorerow>
  </scorelist>
  And your actual scores are as follows:
  <scorelist listtype="scores">
    <scorerow kind="verbal"> Verbal: <scorenum>680</scorenum> </scorerow>
    <scorerow kind="math"> Math: <scorenum>800</scorenum> </scorerow>
  </scorelist>
</sat>Which of the following expressions evaluate to "verbal"?
Select all that apply.
soup.find("scorerow").get("kind")
soup.find("sat").get("ready")
soup.find("scorerow").text.split(":")[0].lower()
[s.get("kind") for s in soup.find_all("scorerow")][-2]
soup.find("scorelist", attrs={"listtype":"scores"}).get("kind")
None of the above
Answer: Option 1, Option 3, Option 4
Correct options:
<scorerow> element and
retrieves its "kind" attribute, which is
"verbal" for the first <scorerow>
encountered in the HTML document.<scorerow> tag,
retrieves its text ("Verbal: 84"), splits this text by “:”,
and takes the first element of the resulting list
("Verbal"), converting it to lowercase to match
"verbal"."kind" attributes for all
<scorerow> elements. The second to last (-2) element
in this list corresponds to the "kind" attribute of the
first <scorerow> in the second
<scorelist> tag, which is also
"verbal".Incorrect options:
<sat> tag, which does not exist as an attribute."kind" attribute from a
<scorelist> tag, but <scorelist>
does not have a "kind" attribute.Consider the following function.
def summer(tree):
    if isinstance(tree, list):
        total = 0
        for subtree in tree:
            for s in subtree.find_all("scorenum"):
                total += int(s.text)
        return total
    else:
        return sum([int(s.text) for s in tree.find_all("scorenum")])
For each of the following values, fill in the blanks to assign
tree such that summer(tree) evaluates to the
desired value. The first example has been done for you.
84 tree = soup.find("scorerow")183 tree = soup.find(__a__)1480 tree = soup.find(__b__)899 tree = soup.find_all(__c__)Answer: a: "scorelist", b:
"scorelist", attrs={"listtype":"scores"}, c:
"scorerow", attrs={"kind":"math"}
soup.find("scorelist") selects the first
<scorelist> tag, which includes both verbal and math
percentiles (84 and 99). The function
summer(tree) sums these values to get 183.
This selects the <scorelist> tag with
listtype="scores", which contains the actual scores of
verbal (680) and math (800). The function sums
these to get 1480.
This selects all <scorerow>elements with
kind="math", capturing both the percentile
(99) and the actual score (800). Since tree is
now a list, summer(tree) iterates through each
<scorerow> in the list, summing their
<scorenum> values to reach 899.
Consider the following HTML document, which represents a webpage containing the top few songs with the most streams on Spotify today in Canada.
<head>
    <title>3*Canada-2022-06-04</title>
<head>
<body>
    <h1>Spotify Top 3 - Canada</h1>
    <table>
        <tr class='heading'>
            <th>Rank</th>
            <th>Artist(s)</th>
            <th>Song</th>
        </tr>
        <tr class=1>
            <td>1</td>
            <td>Harry Styles</td>
            <td>As It Was</td>
        </tr>
        <tr class=2>
            <td>2</td>
            <td>Jack Harlow</td>
            <td>First Class</td>
        </tr>
        <tr class=3>
            <td>3</td>
            <td>Kendrick Lamar</td>
            <td>N95</td>
        </tr>
    </table>
</body>
Suppose we define soup to be a
BeautifulSoup object that is instantiated using the
document above.
How many leaf nodes are there in the DOM tree of the previous document — that is, how many nodes have no children?
Answer: 14
There’s 1 <title>, 1 <h1>, 3
<th>s, and 9 <td>s, adding up to
14.
What does the following line of code evaluate to?
len(soup.find_all("td"))Answer: 9
As mentioned in the solution to the part above, there are 9
<td> nodes, and soup.find_all finds them
all.
What does the following line of code evaluate to?
soup.find("tr").get("class")Answer: ["heading"] or
"heading"
soup.find("tr") finds the first occurrence of a
<tr> node, and get("class") accesses the
value of its "class" attribute.
Note that technically the answer is ["heading"], but
"heading" received full credit too.
Complete the implementation of the function top_nth,
which takes in a positive integer n and returns the
name of the n-th ranked
song in the HTML document. For instance,
top_nth(2) should evaluate to "First Class"
(n=1 corresponds to the top song).
Note: Your implementation should work in the case that the page contains more than 3 songs.
def top_nth(n):
    return soup.find("tr", attrs=__(a)__).find_all("td")__(b)__
What goes in blank (a)?
What goes in blank (b)?
Answer: a) {'class' : n} b)
[2].text or [-1].text
The logic is to find the <tr> node with the
correct class attribute (which we do by setting attr to
{'class' : 2}), then access the text of the node’s last
<td> child (since that’s where the song titles are
stored).
Suppose we run the line of code r = requests.get(url),
where url is a string containing a URL to some online data
source.
True or False: If r.status_code is
200, then r.text must be a string containing
the HTML source code of the site at url.
True
False
Answer: Option B: False
A status code of 200 means that the request has succeeded. Hence, the response could be JSON, it is not necessarily HTML.
Rahul is trying to scrape the website of an online bookstore ‘The Book Club’.
<HTML>
<H1>The Book Club</H1>
<BODY BGCOLOR="FFFFFF">
Email us at <a href="mailto:support@thebookclub.com">
support@thebookclub.com</a>.

<div>
    <ol class="row">
    <li class="book_list">

        <article class="product_pod">
            <div class="image_container">
                    <img src="pic1.jpeg" alt="A Light in the Attic"
                    class="thumbnail">
            </div>

            <p class="star-rating Three"></p>

            <h3>
            <a href="cat/index.html" title="A Light in the Attic">
            A Light in the Attic
            </a>
            </h3>

            <div class="product_price">
                <p class="price_color">£51.77</p>

                <p class="instock availability">
                    <i class="icon-ok"></i>
                    In stock
                </p>

            </div>
        </article>
    </li>
    </ol>

</div>
</BODY>
</HTML>
Which is the equivalent Document Object Model (DOM) tree of this HTML file?
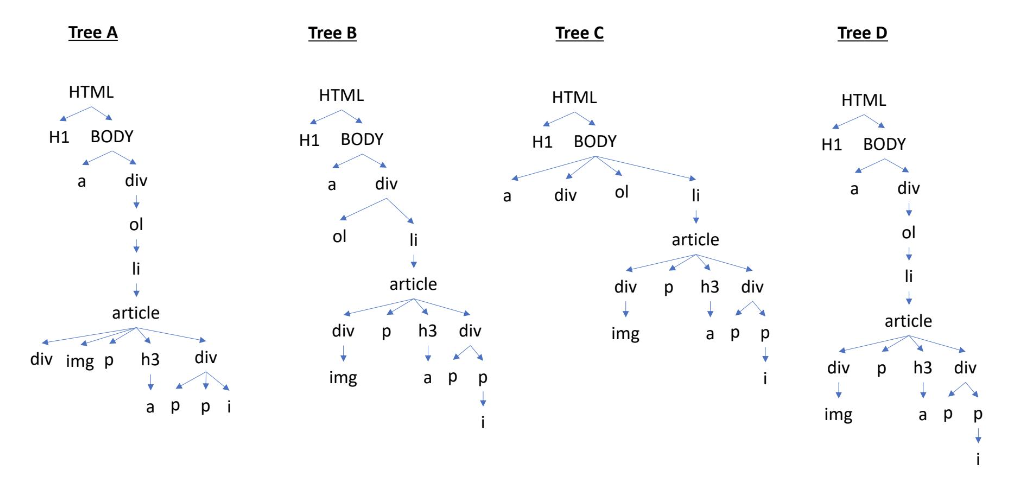
Tree A
Tree B
Tree C
Tree D
Answer: Tree D
Following tree D in the image from top to bottom, we can follow the nesting of tags in the HTML file to verify that the DOM tree D matches the syntax of the HTML file.
Rahul wants to extract the ‘instock availability’ status
of the book titled ‘A Light in the Attic’. Which of the following
expressions will evaluate to "In Stock"? Assume that Rahul
has already parsed the HTML into a BeautifulSoup object stored in the
variable named soup.
Code Snippet A
    soup.find('p',attrs = {'class': 'instock availability'})\
    .get('icon-ok').strip()
Code Snippet B
soup.find('p',attrs = {'class': 'instock availability'}).text.strip()Code Snippet C
    soup.find('p',attrs = {'class': 'instock availability'}).find('i')\
    .text.strip()
Code Snippet D
    soup.find('div', attrs = {'class':'product_price'})\
    .find('p',attrs = {'class': 'instock availability'})\
.find('i').text.strip()Answer: Code Snippet B
Code Snippet B is the only option that finds the tag p
with the attribute class being equal to
instock availability and then getting the text contained in
that tag, which is equal to ‘instock availability’.
Option A will cause an error because of .get('icon-ok')
since 'icon-ok' is not the name of the attribute, but is
instead the value of the class attribute.
Option C and D will both get the text of the i tag,
which is '' and is therefore incorrect.
Rahul also wants to extract the number of stars that the book titled
‘A Light in the Attic’ received. If you look at the HTML file, you will
notice that the book received a star rating of three. Which code snippet
will evaluate to "Three"?
Code Snippet A
soup.find('article').get('class').strip()Code Snippet B
soup.find('p').text.split(' ')Code Snippet C
soup.find('p').get('class')[1]None of the above
Answer: Code Snippet C
Code Snippet C finds the first occurence of the tag p,
gets the contents of its class attribute as a list, and
returns the last element, which is the rating 'Three' as
desired.
Option A will error because .get('class') returns
['product_pod'] and strip cannot be used on a list, but
also the content of the list does not bring us closer to the desired
result.
Option B gets the text contained within the first p tag
as a list, which is [''].
For this problem, consider the HTML document shown below:
<html>
    <head>
        <title>Data Science Courses</title>
    </head>

    <body>
        <h1>Welcome to the World of Data Science!</h1>

        <h2>Current Courses</h2>

        <div class="course_list">

            <img alt="Course Banner", src="courses.png">
            <p>
                Here are the courses available to take:
            </p>
            <ul>
                <li>Machine Learning</li>
                <li>Design of Experiments</li>
                <li>Driving Business Value with DS</li>
            </ul>

            <p>
                For last quarter's classes, see <a href="./2021-sp.html">here</a>.
            </p>

        </div>

        <h2>News</h2>

        <div class="news">
            <p class="news">
                New course on <b>Visualization</b> is launched.
                See <a href="https://http.cat/301.png" target="_blank">here</a>
            </p>
        </div>

    </body>
</html>How many children does the div node with class
course_list contain in the Document Object Model (DOM)?
Answer: 4 children
Looking at the code, we could see that the div with
class course_list has 4 children, namely: a
img node, p node, ul node and
p node.
Suppose the HTML document has been parsed using
doc = bs4.BeautifulSoup(html). Write a line of code to get
the h1 header text in the form of a string.
Answer: doc.find('h1').text
Since there’s only one h1 element in the html code, we
could simply do doc.find('h1') to get the h1
element. Then simply adding .text will get the text of the
h1 element in the form of a string.
Suppose the HTML document has been parsed using
doc = bs4.BeautifulSoup(html). Write a piece of code that
scrapes the course names from the HTML. The value returned by your code
should be a list of strings.
Answer:
[x.text for x in doc.find_all('li')]
Doing doc.find_all('li') will find all li
elements and return it is the form of a list. Simply performing some
basic list comprehension combined .text to get the text of
each li element will yield the desired result.
There are two links in the document. Which of the following will
return the URL of the link contained in the div with class
news? Select all that apply.
doc.find_all('a')[1].attrs['href']
doc.find('a')[1].attrs['href']
doc.find(a, class='news').attrs['href']
doc.find('div', attrs={'class': 'news'}).find('a').attrs['href']
doc.find('href', attrs={'class': 'news'})
Answer: Option A and Option D
doc.find_all('a')
will return a list of all the a elements in the order that
it appears in the HTML document, and since the a with class
news is the second a element appearing in the
HTML doc, we do [1] to select it (as we would in any other
list). Finally, we return the URL of the a element by
getting the 'href' attribute using
.attrs['href'].find will only
find the first instance of a, which is not the one we’re
looking for.a.doc.find('div', attrs={'class': 'news'}) will first find
the div element with class='news', and then
find the a element within that element and get the
href attribute of that, which is what we want.href
element in the HTML document.What is the purpose of the alt attribute in the
img tag?
It provides an alternative image that will be shown to some users at random
It creates a link with text present in alt
It provides the text to be shown below the image as a caption
It provides text that should be shown in the case that the image cannot be displayed
Answer: Option D