← return to study.practicaldsc.org
The problems in this worksheet are taken from past exams in similar classes. Work on them on paper, since the exams you take in this course will also be on paper.
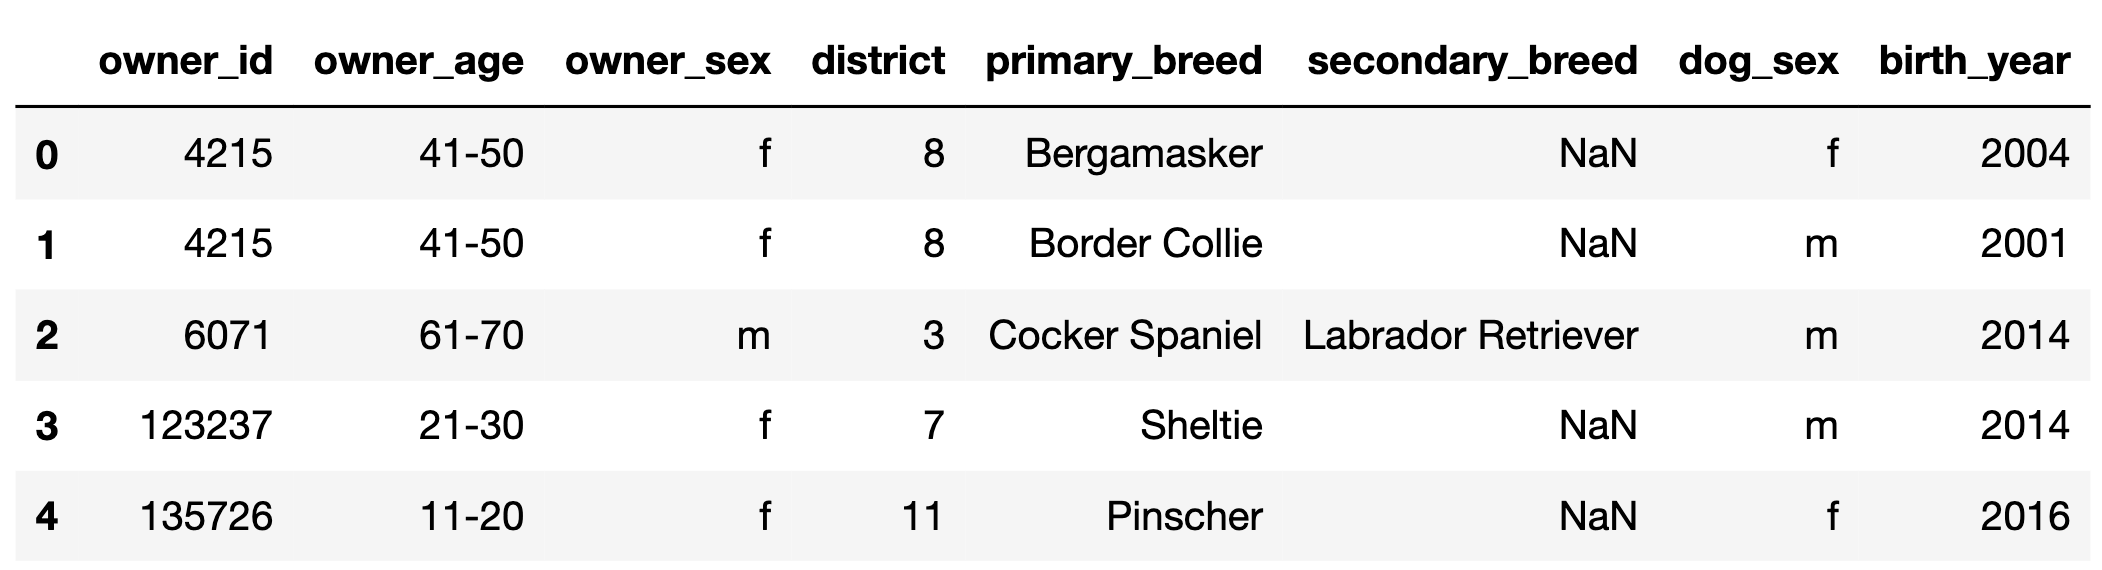
In this problem, we’ll work with the DataFrame dogs,
which contains one row for every registered pet dog in Zurich,
Switzerland in 2017.
The first few rows of dogs are shown below, but
dogs has many more rows than are shown.
"owner_id" (int): A unique ID for each owner. Note
that, for example, there are two rows in the preview for
4215, meaning that owner has at least 2 dogs.
Assume that if an "owner_id" appears in
dogs multiple times, the corresponding
"owner_age", "owner_sex", and
"district" are always the same."owner_age" (str): The age group of the owner; either
"11-20", "21-30", …, or "91-100"
(9 possibilities in total)."owner_sex" (str): The birth sex of the owner; either
"m" (male) or "f" (female)."district" (int): The city district the owner lives in;
a positive integer between 1 and 12
(inclusive)."primary_breed" (str): The primary breed of the
dog."secondary_breed" (str): The secondary breed of the
dog. If this column is not null, the dog is a “mixed breed” dog;
otherwise, the dog is a “purebred” dog."dog_sex" (str): The birth sex of the dog; either
"m" (male) or "f" (female)."birth_year" (int): The birth year of the dog.Fill in the blank so that most_common evaluates to the
most common district in dogs. Assume there are no ties.
most_common = ____Answer:
dogs["district"].value_counts().idxmax()To find the most common district in the ’dogs’
DataFrame, the solution uses the value_counts() method,
which counts the occurrences of each unique value in the
’district’ column. The idxmax() method is then
used to identify the index of the maximum value in the resulting series,
which corresponds to the most frequent district. Above, we presented one
possible solution, but there are many:
dogs["district"].value_counts().index[0]
Directly selects the first district in the sorted counts.
dogs.groupby("district").size().sort_values(ascending=False).index[0]
Groups by ’district’, counts rows in each group, sorts by
count, and retrieves the first district. Additionally, grouping by
’district’ and using .size() does the same
thing as using .value_counts() on the
’district’ column; the only difference is that the values
are sorted in a different order, which is why we set
ascending=False
dogs.groupby("district").count()["owner_id"].sort_values(ascending=False).index[0]
Counts non-NaN values of owner_id for each district, sorts
by count, and retrieves the first district.
Fill in the blank so that female_breeds evaluates to a
Series containing the primary breeds of all female dogs.
female_breeds = dogs.____Answer:
loc[dogs["dog_sex"] == "f", "primary_breed"]Another possible answer is:
query("dog_sex == 'f'")["primary_breed"]Note that the question didn’t ask for unique primary breeds.
In this problem, we will work with the DataFrame tv,
which contains information about various TV shows available to watch on
streaming services. For each TV show, we have:
"Title" (object): The title of the TV show."Year" (int): The year in which the TV show was first
released. (For instance, the show How I Met Your Mother ran
from 2005 to 2014; there is only one row for How I Met Your
Mother in tv, and its "Year" value is
2005.)"Age" (object): The age category for the TV show. If
not missing, "Age" is one of "all",
"7+", "13+", "16+", or
"18+". (For instance, "all" means that the
show is appropriate for all audiences, while `“18+”} means that the show
contains mature content and viewers should be at least 18 years
old.)"IMDb" (float): The TV show’s rating on IMDb (between 0
and 10)."Rotten Tomatoes" (int): The TV show’s rating on Rotten
Tomatoes (between 0 and 100)."Netflix" (int): 1 if the show is available for
streaming on Netflix and 0 otherwise. The "Hulu",
"Prime Video", and "Disney+" columns work the
same way.The first few rows of tv are shown below (though
tv has many more rows than are pictured here).
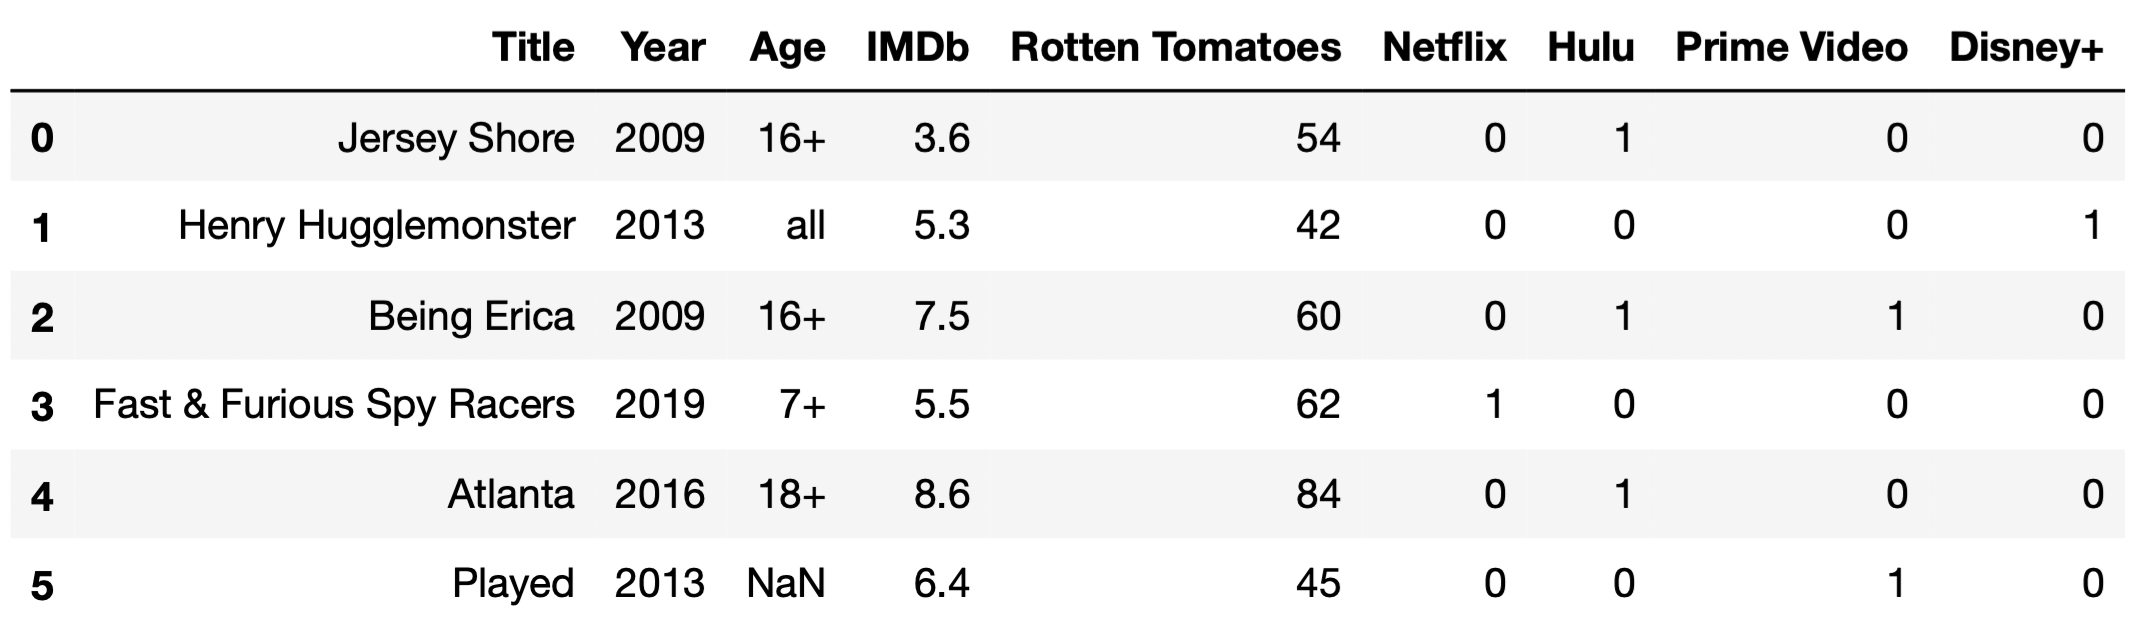
As you see in the first few rows of tv, some TV shows
are available for streaming on multiple streaming services. Fill in the
blanks so that the two expressions below, Expression 1 and Expression 2,
both evaluate to the "Title" of the TV
show that is available for streaming on the greatest number of
streaming services. Assume there are no ties and that the
"Title" column contains unique values.
Expression 1:
tv.set_index("Title").loc[__(a)__].T.sum(axis=0).idxmax()Expression 2:
    (
        tv.assign(num_services=tv.iloc[__(b)__].sum(__(c)__))
            .sort_values("num_services")
            .iloc[__(d)__]
)Hint: .T transposes the rows
and columns of a DataFrame — the indexes of df are the
columns of df.T and vice versa.
What goes in the blanks?
Answers:
:, "Netflix": or some variation of that:, 5: or some variation of thataxis=1-1, 0In Expression 1, keep in mind that idxmax() is a Series
method returns the index of the row with the maximum value. As such, we
can infer that Expression 1 sums the service-specific indicator columns
(that is, the columns "Netflix", "Hulu",
"Prime Video", and "Disney+") for each row and
returns the index of the row with the greatest sum. To do this, we need
the loc accessor to select all the service-specific
indicator columns, which we can do using loc[:, "Netflix":]
or
loc[:, ["Netflix", "Hulu", "Prime Video", "Disney+"]].
When looking at Expression 2, we can split the problem into two
parts: the code inside the assign statement and the code
outside of it.
assign statement,
(and also noticing the variable num_services), we realize
that we, once again, want to sum up the values in the service-specific
indicator columns. We do this by first selecting the last four columns,
using .iloc[:, 5:] (notice the iloc), and then
summing over axis=1. We use axis=1 (different
from axis=0 in Expression 1), because unlike Expression 1,
we’re summing over each row, instead of each column. If there had not
been a .T in the code for Expression 1, we would’ve also
used axis=1 in Expression 1."Title" of the last row
in DataFrame in Expression 2, because sort_values sorts in
ascending order by default. The last row has an integer position of -1,
and the "Title" column has an integer position of 0, so we
use iloc[-1, 0].In the following subparts, consider the variable
double_count, defined below.
double_count = tv["Title"].value_counts().value_counts()What is type(double_count)?
Series
SeriesGroupBy
DataFrame
DataFrameGroupBy
Answer: Series
The .value_counts() method, when called on a Series
s, produces a new Series in which
s.s.Since tv["Title"] is a Series,
tv["Title"].value_counts() is a Series, and so is
tv["Title"].value_counts.value_counts(). We provide an
interpretation of each of these Series in the solution to the next
subpart.
Which of the following statements are true? Select all that apply.
The only case in which it would make sense to set the index of
tv to "Title" is if
double_count.iloc[0] == 1 is True.
The only case in which it would make sense to set the index of
tv to "Title" is if
double_count.loc[1] == tv.shape[0] is
True.
If double_count.loc[2] == 5 is True, there
are 5 TV shows that all share the same "Title".
If double_count.loc[2] == 5 is True, there
are 5 pairs of 2 TV shows such that each pair shares the same
"Title".
None of the above.
Answers:
tv to "Title" is if
double_count.loc[1] == tv.shape[0] is
True.double_count.loc[2] == 5 is True, there
are 5 pairs of 2 TV shows such that each pair shares the same
"Title".To answer, we need to understand what each of
tv["Title"], tv["Title"].value_counts(), and
tv["Title"].value_counts().value_counts() contain. To
illustrate, let’s start with a basic, unrelated example. Suppose
tv["Title"] looks like:
0    A
1    B
2    C
3    B
4    D
5    E
6    A
dtype: object
Then, tv["Title"].value_counts() looks like:
A    2
B    2
C    1
D    1
E    1
dtype: int64
and tv["Title"].value_counts().value_counts() looks
like:
1    3
2    2
dtype: int64
Back to our actual dataset. tv["Title"], as we know,
contains the name of each TV show.
tv["Title"].value_counts() is a Series whose index is a
sequence of the unique TV show titles in tv["Title"], and
whose values are the frequencies of each title.
tv["Title"].value_counts() may look something like the
following:
Breaking Bad                             1
Fresh Meat                               1
Doctor Thorne                            1
                                       ...
Styling Hollywood                        1
Vai Anitta                               1
Fearless Adventures with Jack Randall    1
Name: Title, Length: 5368, dtype: int64
Then, tv["Title"].value_counts().value_counts() is a
Series whose index is a sequence of the unique values in the above
Series, and whose values are the frequencies of each value above. In the
case where all titles in tv["Title"] are unique, then
tv["Title"].value_counts() will only have one unique value,
1, repeated many times. Then,
tv["Title"].value_counts().value_counts() will only have
one row total, and will look something like:
1    5368
Name: Title, dtype: int64
This allows us to distinguish between the first two answer choices. The key is remembering that in order to set a column to the index, the column should only contain unique values, since the goal of the index is to provide a “name” (more formally, a label) for each row.
tv to "Title" is if
double_count.iloc[0] == 1 is True”, is false.
As we can see in the example above, all titles are unique, but
double_count.iloc[0] is something other than 1.tv to "Title" is if
double_count.loc[1] == tv.shape[0] is True”,
is true. If double_count.loc[1] == tv.shape[0], it means
that all values in tv["Title"].value_counts() were 1,
meaning that tv["Title"] consisted solely of unique values,
which is the only case in which it makes sense to set
"Title" to the index.Now, let’s look at the second two answer choices. If
double_counts.loc[2] == 5, it would mean that 5 of the
values in tv["Title"].value_counts() were 2. This would
mean that there were 5 pairs of titles in tv["Title"] that
were the same.
double_count.loc[2] == 5 is True, there are 5
pairs of 2 TV shows such that each pair shares the same
"Title"”, correct.double_count.loc[2] == 5
is True, there are 5 TV shows that all share the same
"Title"”, is incorrect; if there were 5 TV shows with the
same title, then double_count.loc[5] would be at least 1,
but we can’t make any guarantees about
double_counts.loc[2].Suppose you are given a DataFrame of employees for a given company.
The DataFrame, called employees, is indexed by
'employee_id' (string) with a column called
'years' (int) that contains the number of years each
employee has worked for the company. Suppose that the code
employees.sort_values(by='years', ascending=False).index[0]outputs '2476'.
True or False: The number of years that employee 2476 has worked for the company is greater than the number of years that any other employee has worked for the company.
True
False
Answer: False
This is false because there could be other employees who worked at the company equally long as employee 2476.
The code says that when the employees DataFrame is
sorted in descending order of 'years', employee 2476 is in
the first row. There might, however, be a tie among several employees
for their value of 'years'. In that case, employee 2476 may
wind up in the first row of the sorted DataFrame, but we cannot say that
the number of years employee 2476 has worked for the company is greater
than the number of years that any other employee has worked for the
company.
If the statement had said greater than or equal to instead of greater than, the statement would have been true.
You are given a DataFrame called sports, indexed by
'Sport' containing one column,
'PlayersPerTeam'. The first few rows of the DataFrame are
shown below:
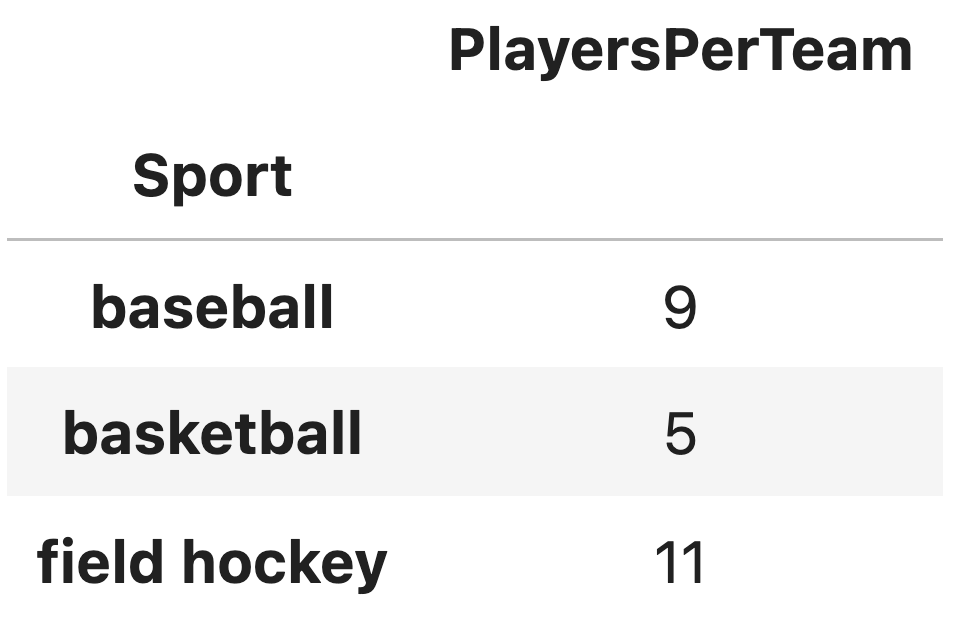
Which of the following evaluates to 'basketball'?
sports.loc[1]
sports.iloc[1]
sports.index[1]
sports['Sport'].iloc[1]
Answer: sports.index[1]
We are told that the DataFrame is indexed by 'Sport' and
'basketball' is one of the elements of the index. To access
an element of the index, we use .index to extract the index
and square brackets to extract an element at a certain position.
Therefore, sports.index[1] will evaluate to
'basketball'.
The first two answer choices attempt to use .loc or
.iloc directly on a DataFrame. Specifically,
sports.loc[1] attempts to locate a row with the index label
1. However, since the DataFrame is indexed by
'Sport', and 1 is not a valid index label,
this would result in a KeyError. On the other hand,
sports.iloc[1] accesses the second row of the DataFrame
(based on zero-based indexing), but it returns the entire row as a
Series, including all its columns.
The last answer choice is incorrect because 'Sport' is
not a column in the DataFrame. Instead, 'Sport' is the
index of the DataFrame, which is never considered a column.
Which of the following expressions evaluate to 5?
sports.loc['basketball', 'PlayersPerTeam']
sports['PlayersPerTeam'].loc['basketball']
sports['PlayersPerTeam'].iloc[1]
sports.loc['PlayersPerTeam']['basketball']
sports.loc['basketball']
sports.iloc[1]
Answer: The first three options are correct.
sports.loc['basketball', 'PlayersPerTeam']:
.loc will access the value of a specific row
('basketball') and column ('PlayersPerTeam')
by label. This will return 5.
sports['PlayersPerTeam'].loc['basketball']:
Selecting the column 'PlayersPerTeam' as a Series and then
using .loc['basketball'] accesses the value for the
'basketball' index, returning 5.
sports['PlayersPerTeam'].iloc[1]:
Selecting the column 'PlayersPerTeam' as a Series and using
.iloc[1] accesses the second value (index 1)
in the Series, which corresponds to 'basketball'. This will
also return 5.
sports.loc['PlayersPerTeam']['basketball']:
This throws a KeyError because 'PlayersPerTeam' is not a
valid index label in the DataFrame. The sports DataFrame is
indexed by 'Sport', so attempting to locate a row labeled
'PlayersPerTeam' is invalid.
sports.loc['basketball']: While this syntax is
valid, it retrieves the entire row corresponding to the index
'basketball'. The result will be a Series, not just the
single value.
sports.iloc[1]: In this case,
sports.iloc[1] retrieves the entire second row of the
DataFrame.